Analysis of Interval- and Ratio-scale Data
### Unit IV: Analysis of Interval- and Ratio-scale Data
#### A. **Rationale**
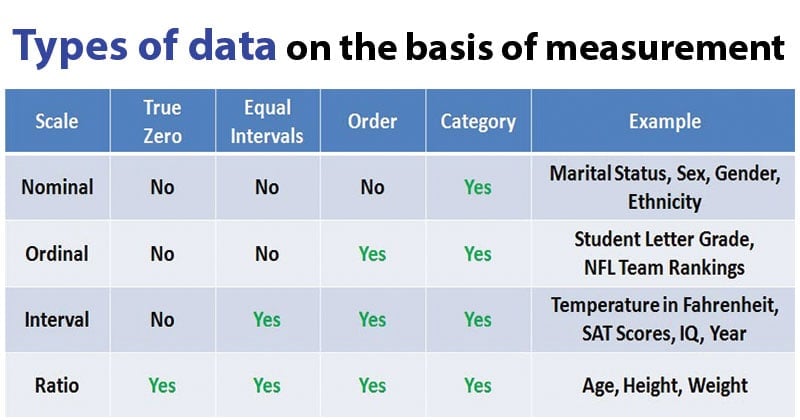
Interval- and ratio-scale data allow for more sophisticated statistical analyses because both scales measure continuous variables. Interval data has meaningful intervals between values, but no true zero point (e.g., temperature in Celsius), while ratio data has a true zero (e.g., income, age). The rationale for analyzing such data is to gain deeper insights into relationships, patterns, and trends, making it possible to perform tests of significance and assess the strength and nature of relationships between variables. This allows researchers to make more precise and reliable inferences about populations.
---
#### B. **Univariate Data Analysis: One-Sample Z, t, and F Tests**
- **Z Test**: A statistical test used to determine whether the mean of a population is significantly different from a hypothesized value when the population variance is known and the sample size is large (n > 30).
- Formula:
\[
Z = \frac{\bar{X} - \mu}{\sigma / \sqrt{n}}
\]
Where:
- \(\bar{X}\) = Sample mean
- \(\mu\) = Population mean
- \(\sigma\) = Population standard deviation
- \(n\) = Sample size
- **t-Test**: Used when the population variance is unknown and the sample size is small (n < 30). It tests whether the sample mean is significantly different from a hypothesized population mean.
- Formula:
\[
t = \frac{\bar{X} - \mu}{s / \sqrt{n}}
\]
Where:
- \(s\) = Sample standard deviation (used instead of population standard deviation).
- **F Test**: Used to compare the variances of two populations or assess whether multiple group means differ significantly (ANOVA). This test is critical for understanding whether variability between groups is due to chance or a real difference.
---
#### C. **Bivariate Data Analysis**
- **Two-Way Frequency Table**: Similar to nominal data analysis, but in interval/ratio data, the emphasis is more on measuring the strength of the relationship between variables.
- **Scatter Diagram**: A graphical representation that plots two variables on a Cartesian plane. It helps in visualizing the relationship between two interval or ratio variables. The pattern in the scatter diagram provides clues about the direction and strength of the relationship.
- **Correlation Coefficient**: Measures the strength and direction of the relationship between two variables. The most common is **Pearson’s r**, which ranges from -1 to 1. A value close to 1 or -1 indicates a strong relationship, while a value near 0 indicates a weak or no relationship.
- Formula for Pearson's r:
\[
r = \frac{n(\sum xy) - (\sum x)(\sum y)}{\sqrt{[n\sum x^2 - (\sum x)^2][n\sum y^2 - (\sum y)^2]}}
\]
- **Simple Linear Regression**: A method for predicting the value of a dependent variable based on the value of an independent variable. It establishes a linear relationship between two variables.
- Formula:
\[
Y = a + bX
\]
Where:
- \(Y\) = Dependent variable
- \(X\) = Independent variable
- \(a\) = Intercept
- \(b\) = Slope (rate of change).
- **Two-Sample Z, t, and F Tests**: These are extensions of the one-sample tests, used when comparing two independent groups:
- **Two-sample Z Test**: Compares the means of two independent samples when the population variances are known.
- **Two-sample t-Test**: Used when population variances are unknown, and it tests whether two sample means differ significantly.
- **Two-sample F Test**: Compares the variances of two independent samples.
- **Significance Tests of Correlation and Regression Coefficients**: These tests determine whether the observed correlation or regression coefficients are statistically significant. The hypothesis test checks if the correlation or slope coefficient is significantly different from zero, indicating a meaningful relationship between the variables.
---
#### D. **Interpretation**
The interpretation of these analyses involves understanding the meaning of the statistical output and its implications. For example:
- In correlation analysis, you interpret the direction (positive or negative) and strength of the relationship.
- In regression analysis, the slope coefficient (\(b\)) indicates the rate of change in the dependent variable for each unit change in the independent variable.
- In significance tests, p-values are used to determine whether the results are statistically significant. A p-value less than 0.05 typically indicates that the relationship or difference is not due to random chance.
---
#### E. **Inference**
Inferences from interval and ratio data analysis help researchers generalize their findings from a sample to the larger population. These tests allow you to make informed conclusions, such as predicting outcomes (e.g., predicting income based on education level), or understanding the strength and nature of relationships between variables in the population. Confidence intervals and hypothesis testing are essential for making these inferences reliable.
---
### **Readings** for this Unit:
1. **Blalock, H.M.** (1969). *Interval Scales: Frequency distribution and graphic presentation* (Chapter 4, pp. 41-54): This chapter covers the basics of summarizing interval-scale data using frequency distributions and visual methods like graphs.
2. **Blalock, H.M.** (1969). *Interval Scales: Measures of Central Tendency* (Chapter 5, pp. 55-76): This reading focuses on the measures of central tendency (mean, median, mode) for interval data.
3. **Blalock, H.M.** (1969). *Two Samples Test: Difference of Means and Proportions* (Chapter 13, pp. 219-242): This chapter explains how to test for significant differences between two samples.
4. **Levin and Fox**, *Elementary Statistics in Social Research*, Chapter 7: "Testing Differences between Means" (pp. 235-268): This reading explains various methods for testing mean differences between groups using z, t, and F tests.
5. **Blalock, H.M.** (1969). *Correlation and Regression* (Chapter 17, pp. 361-396): This chapter provides an in-depth understanding of correlation and regression analysis, crucial for analyzing interval and ratio data.
6. **Levin and Fox**, *Elementary Statistics in Social Research*, Chapters 10 and 11 (pp. 345-392): These chapters further elaborate on correlation and regression analysis, including testing for significance of relationships and interpreting regression coefficients.
These readings will guide you through the theoretical and practical aspects of analyzing interval and ratio-scale data in sociological research. Let me know if you'd like to explore any topic in more detail!


No comments:
Post a Comment
If you have any doubts. Please let me know.