Basic Statistics in Sociological Research

Basic Statistics in Sociological Research


## Basic Statistics in Sociological Research


Statistics play a crucial role in sociological research, providing the tools necessary for analyzing social phenomena, understanding human behavior, and informing policy decisions. This overview will cover the fundamental concepts of statistics as applied in sociological contexts, the types of statistics used, and the significance of statistical methods in social research.


### Understanding Statistics in Sociology


Statistics in sociology can be broadly categorized into two types: **descriptive statistics** and **inferential statistics**.


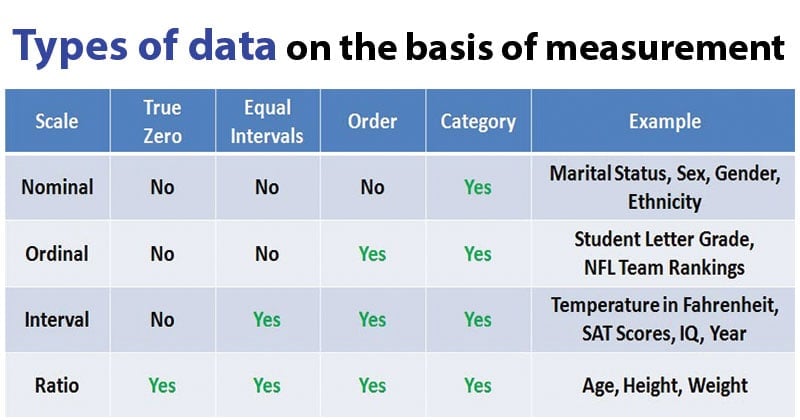
- **Descriptive Statistics**: These statistics summarize and describe the characteristics of a dataset. Common measures include:

  - **Mean**: The average value.

  - **Median**: The middle value when data is ordered.

  - **Mode**: The most frequently occurring value.

  - **Standard Deviation**: A measure of the amount of variation or dispersion in a set of values.


Descriptive statistics are essential for providing a clear picture of the data at hand, allowing researchers to present findings in a comprehensible manner.


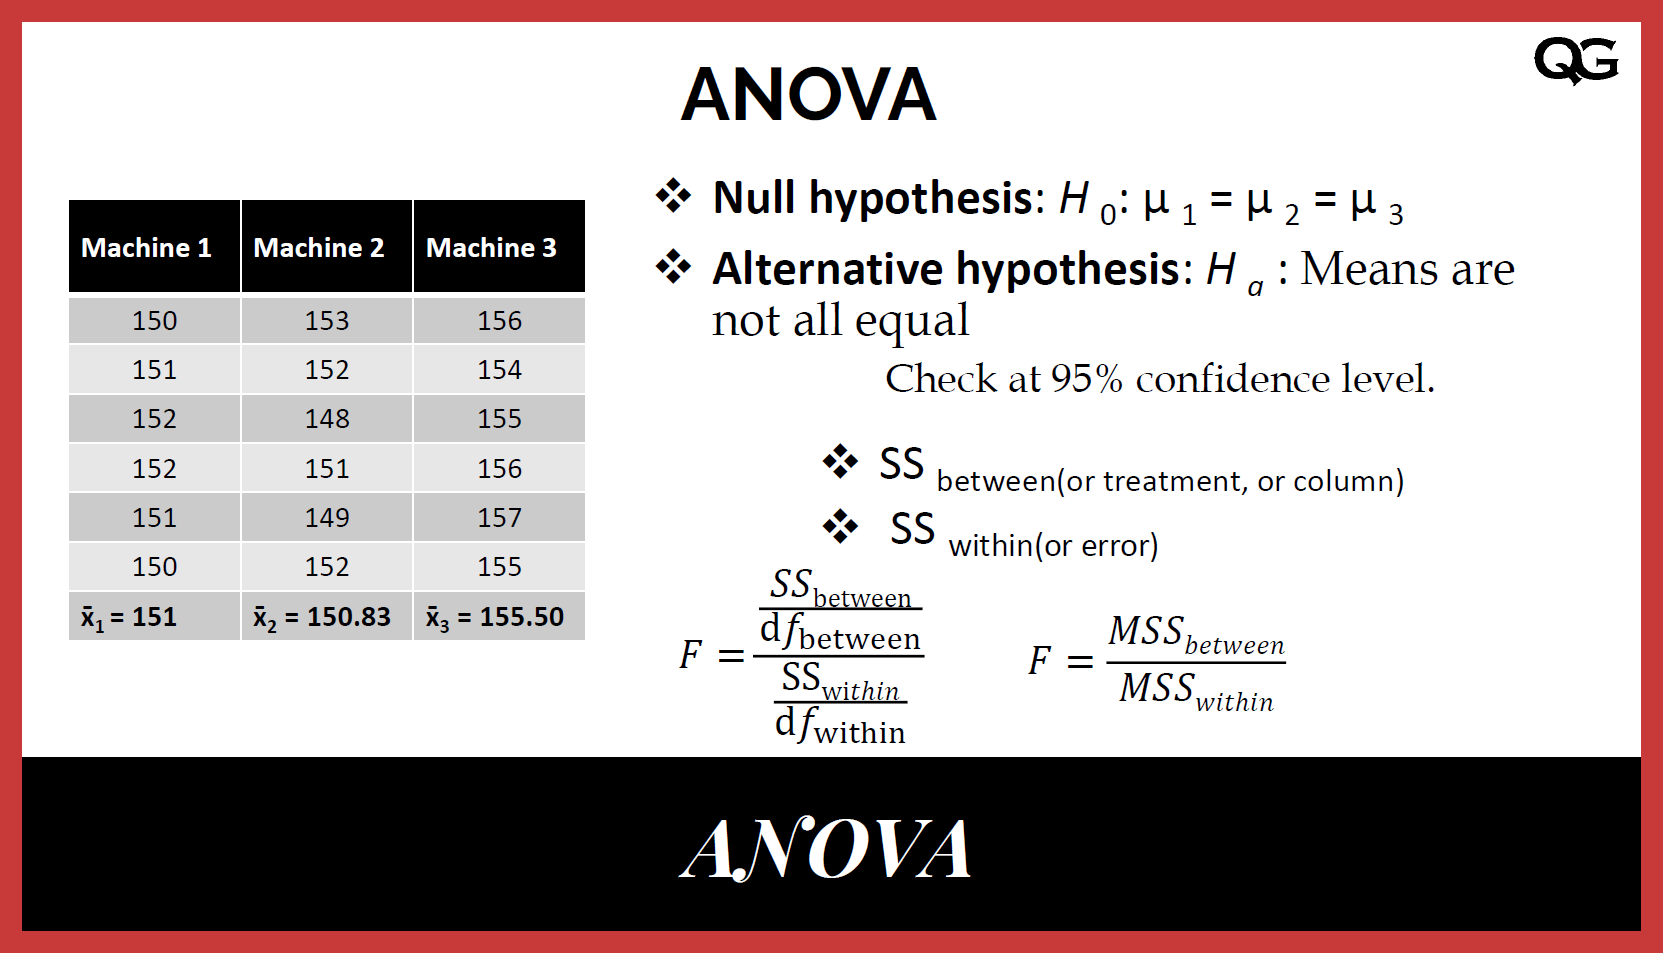
- **Inferential Statistics**: This type involves making predictions or inferences about a population based on a sample of data. It includes:

  - **Hypothesis Testing**: Determining whether there is enough evidence to support a specific hypothesis.

  - **Confidence Intervals**: Estimating the range within which a population parameter lies with a certain level of confidence.

  - **Regression Analysis**: Exploring relationships between variables to predict outcomes.


Inferential statistics are vital for generalizing findings from a sample to a broader population, enabling sociologists to draw conclusions that can inform social policies and interventions.


### The Role of Social Statistics


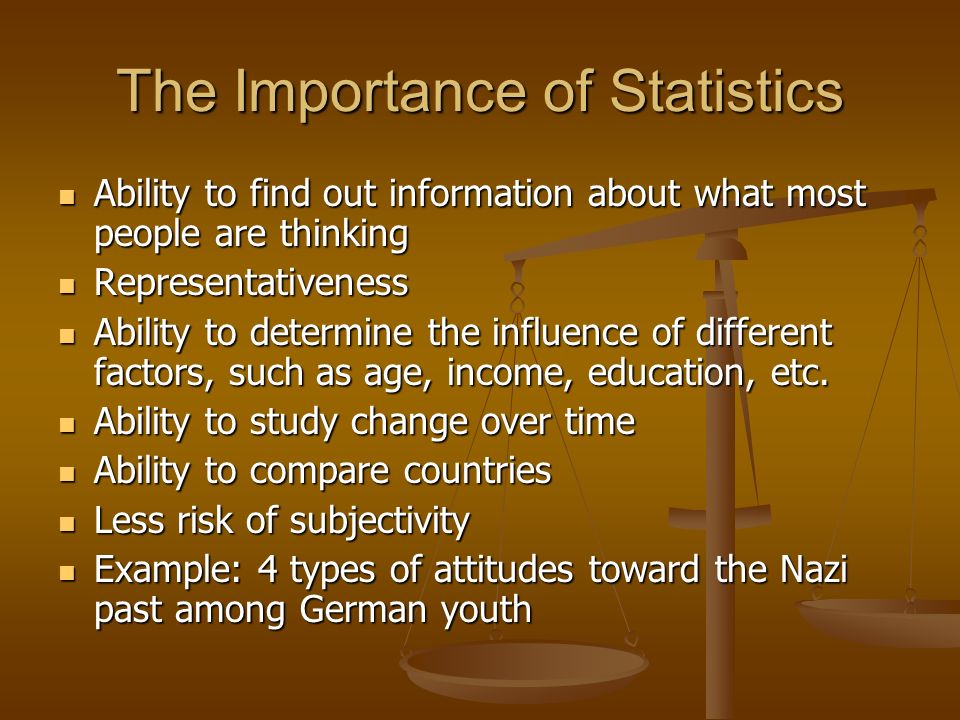
Social statistics are employed to study various aspects of human behavior and societal structures. They help answer critical questions such as:


- How do socioeconomic factors influence educational attainment?

- What is the relationship between income levels and health outcomes?

- How do demographic changes affect community dynamics?


By employing statistical methods, sociologists can analyze trends, test theories, and evaluate the impact of policies on different social groups. For instance, social statistics can be used to assess the effectiveness of welfare programs by comparing poverty rates before and after implementation[2].


### Data Collection and Analysis


The process of statistical analysis in sociological research involves several key steps:


1. **Planning and Designing**: Researchers must define their research questions clearly and design a study that will effectively address these questions. This includes selecting appropriate methodologies (e.g., surveys, experiments, observational studies).


2. **Data Collection**: This involves gathering data through various means such as surveys, interviews, or existing databases. The choice of data collection method can significantly impact the quality of the data obtained.


3. **Data Analysis**: Once data is collected, statistical software (e.g., SPSS, R) is often used to perform analyses. This step includes applying descriptive and inferential statistical techniques to interpret the data and draw conclusions.


4. **Reporting Findings**: The results of the analysis are then reported, often including visual representations such as graphs and tables to enhance understanding.


### Importance of Statistical Literacy


Statistical literacy is crucial for sociologists and social researchers. A solid understanding of statistical concepts enables researchers to design effective studies, analyze data accurately, and interpret results responsibly. Misapplication of statistical methods can lead to erroneous conclusions, which may have significant ethical implications in social research[5].


### Conclusion


Basic statistics are foundational to sociological research, providing the necessary tools for understanding complex social dynamics. By utilizing both descriptive and inferential statistics, sociologists can analyze data effectively, draw meaningful conclusions, and contribute to the development of informed social policies. As the field of sociology continues to evolve, the importance of statistical literacy and the application of robust statistical methods will remain paramount in addressing the challenges faced by societies today.


Citations:

[1] https://www.wiley.com/en-us/Basic%2BStatistics%2Bfor%2BSocial%2BResearch-p-9781118234150

[2] https://www.socialsciences.manchester.ac.uk/social-statistics/about/what-is-social-statistics/

[3] https://books.google.com/books/about/Basic_Statistics_for_Social_Research.html?id=ySxjvXKFRVMC

[4] https://the-sra.org.uk/SRA/Shared_Content/Events/Event_display.aspx?EventKey=BSASR19

[5] https://www.ncbi.nlm.nih.gov/pmc/articles/PMC5037948/

[6] https://www.youtube.com/watch?v=MNE4he4A8KY

[7] https://www.thoughtco.com/introduction-to-statistics-3026701

[8] https://www.amazon.com/Statistics-Social-Research-Robert-Hanneman/dp/0470587989

The Importance of Basic Statistics in Sociology

 The Importance of Basic Statistics in Sociology


## The Importance of Basic Statistics in Sociology


Statistics play a crucial role in sociological research by providing empirical data that can be analyzed to understand social phenomena[2]. Sociologists use statistical methods to study cultural change, family patterns, prostitution, crime, marriage systems, and other aspects of society[6]. Statistics allow sociologists to:


- Identify trends and patterns in social behavior[2][4]

- Examine relationships between variables like poverty, crime, and education[6] 

- Make comparisons across different social groups and over time[2]

- Generalize findings from sample data to larger populations[7]

- Test hypotheses about social issues[7]


## Key Statistical Methods Used in Sociology


Some of the most commonly used statistical methods in sociology include[1][3][4][5]:


- **Descriptive statistics**: Summarizing and describing sample data using measures of central tendency (mean, median, mode) and dispersion (range, variance, standard deviation)

- **Inferential statistics**: Drawing conclusions about populations from sample data, including hypothesis testing and confidence intervals

- **Bivariate statistics**: Examining relationships between two variables, such as correlation and regression analysis

- **Multivariate statistics**: Analyzing the effects of multiple independent variables on a dependent variable simultaneously, including techniques like multiple regression and factor analysis

- **Categorical data analysis**: Methods for analyzing data measured at the nominal or ordinal level, including chi-square tests and loglinear models


## The Role of Statistics in the Sociology Research Process


Sociological research often follows a quantitative approach that relies heavily on statistical methods[7]. The key steps in this process include:


1. **Formulating a research question** that can be answered using empirical data

2. **Collecting data** through surveys, experiments, or secondary sources like official statistics 

3. **Analyzing the data** using appropriate statistical techniques to identify patterns and test hypotheses

4. **Interpreting the results** in the context of the research question and existing sociological theory

5. **Drawing conclusions** about the social phenomenon under study


## Advantages and Limitations of Statistics in Sociology


While statistics provide valuable insights, they also have limitations that sociologists must consider[2][9]:


Advantages:

- Quantitative data is considered more reliable by positivist sociologists

- Large-scale statistics are representative and generalizable 

- Statistics allow for comparisons across groups and over time

- Easily accessible and cost-effective data source


Limitations:

- May not capture meanings, motives, and individual interpretations (interpretivist view)

- Official statistics may lack validity and be subject to bias

- Changes in measurement over time can affect historical comparisons

- Collecting and analyzing data can be costly and time-consuming


In conclusion, basic statistics are essential tools for sociologists to empirically study social phenomena. While statistics have limitations, they provide valuable insights when used appropriately in conjunction with other research methods. Mastering statistical techniques is a key skill for sociology students to develop.


Citations:

[1] https://www.wiley.com/en-us/Basic%2BStatistics%2Bfor%2BSocial%2BResearch-p-9781118234150

[2] https://www.geniushigh.com/sociology-essay/the-use-of-statistics-in-sociological-research

[3] https://www.emerald.com/insight/content/doi/10.1108/JHASS-08-2019-0038/full/html

[4] https://www.encyclopedia.com/social-sciences/encyclopedias-almanacs-transcripts-and-maps/statistical-methods

[5] https://eco.u-szeged.hu/download.php?docID=40429

[6] https://www.sociologyguide.com/research-methods%26statistics/applications-of-statistics.php

[7] https://sociology.rutgers.edu/documents/undergraduate-course-syllabi/spring-2021-undergrad-syllabi-1/1287-20211-01-920-312-01/file

[8] https://www.socialsciences.manchester.ac.uk/social-statistics/about/what-is-social-statistics/

[9] https://www.studysmarter.co.uk/explanations/social-studies/theories-and-methods/official-statistics/

Basic Statistics in Sociological Research Important Questions

 Basic Statistics in Sociological Research Important Questions


Here are 10 important questions that cover the key concepts from all the units you've studied so far. These questions will help you prepare for your exams, focusing on both theoretical understanding and practical application:


### **Unit I: Key Statistical Concepts**


1. **Explain the differences between univariate, bivariate, and multivariate data. Provide examples of how each type can be used in sociological research.**

   - This question tests your understanding of different data types and their applications.


2. **Discuss the importance of summarizing data through measures of central tendency and measures of dispersion. How do mean, median, mode, range, variance, and standard deviation help in sociological analysis?**

   - This will require you to explain the significance of these statistical measures and how they are applied.


3. **Compare and contrast cross-sectional, cohort, and panel data. In what situations would each type be used in sociological research?**

   - This question focuses on different research designs and when to use each.


---


### **Unit II: Analysis of Nominal-scale Data**


4. **What is the rationale for analyzing nominal-scale data? How are proportions, percentages, and ratios used in nominal-scale analysis?**

   - You need to explain the reasoning behind nominal-scale data analysis and its practical application.


5. **Explain how the chi-square test is used in bivariate analysis of nominal-scale data. What is the role of the level of significance in this analysis?**

   - This will test your understanding of the chi-square test and significance levels in sociological research.


---


### **Unit III: Analysis of Ordinal-scale Data**


6. **Discuss the rationale for analyzing ordinal-scale data. How do you interpret the results of a rank correlation coefficient?**

   - This question focuses on the rationale for ordinal data analysis and the interpretation of rank correlation.


---


### **Unit IV: Analysis of Interval- and Ratio-scale Data**


7. **What is the difference between a one-sample Z test, t-test, and F test? In what research situations would you use each?**

   - This question tests your knowledge of the different tests for interval and ratio data and their applications.


8. **Explain the concept of a scatter diagram and correlation coefficient. How would you interpret a Pearson's correlation coefficient in a sociological study?**

   - This requires you to explain and apply the concept of correlation to real-world sociological research.


---


### **Unit V: Analysis of Variance (ANOVA)**


9. **What is the logic behind Analysis of Variance (ANOVA)? How does ANOVA differ from a t-test, and when would you use ANOVA in sociological research?**

   - This question will assess your understanding of the fundamental logic of ANOVA and its comparison to other statistical tests.


10. **After conducting ANOVA, why is it necessary to perform multiple comparison tests? Describe Tukey's HSD and how it is used to interpret the results of ANOVA.**

   - This will test your understanding of post-hoc tests and their importance after ANOVA.


---


These questions cover a wide range of statistical concepts, including data types, analysis techniques, and interpretation, all essential for your sociology exams. Let me know if you need any additional explanations or practice questions!

Analysis of Variance (ANOVA)

Analysis of Variance (ANOVA)


### Unit V: Analysis of Variance (ANOVA)


#### A. **The Logic of Analysis of Variance**

Analysis of Variance (ANOVA) is a statistical technique used to determine whether there are significant differences between the means of three or more groups. The key logic behind ANOVA is to test the hypothesis that all group means are equal, versus the alternative hypothesis that at least one group mean is different. 


ANOVA compares the variance within each group to the variance between the groups:

- **Within-group variance** measures how much individuals in the same group differ from the group mean.

- **Between-group variance** measures how much the group means differ from the overall mean.


If the between-group variance is significantly larger than the within-group variance, it suggests that the groups are not all the same, leading to the rejection of the null hypothesis.


The F-ratio is used in ANOVA to compare these variances:

\[

F = \frac{\text{Between-group variance}}{\text{Within-group variance}}

\]

If the F-ratio is large, it suggests that there is a significant difference between group means.


---


#### B. **Analysis of Variance**

ANOVA can be conducted for different types of data:

- **One-Way ANOVA**: Used when comparing the means of three or more independent groups on one factor. For example, you might compare the academic performance (measured by test scores) of students from three different educational methods.


  Steps in One-Way ANOVA:

  1. Calculate the **total variance** (the variance of all observations).

  2. Break down the total variance into **between-group variance** and **within-group variance**.

  3. Compute the **F-ratio**.

  4. Compare the F-ratio to a critical value from the F-distribution table, which depends on the number of groups and sample sizes. If the calculated F-ratio is larger than the critical value, the null hypothesis (that all group means are equal) is rejected.


- **Two-Way ANOVA**: Used when there are two independent variables, allowing the researcher to assess not only the main effects of each variable but also the interaction effect between the two variables. For instance, you might examine the effects of both gender and study method on academic performance.


---


#### C. **Multiple Comparison of Means**

After conducting ANOVA, if the null hypothesis is rejected, it indicates that at least one group mean is different, but it doesn’t specify which groups are significantly different. To determine which specific group means differ from each other, **multiple comparison tests** (also called post hoc tests) are used. Common methods include:


- **Tukey’s Honestly Significant Difference (HSD)**: Compares all possible pairs of means to identify which ones are significantly different.


- **Bonferroni Correction**: Adjusts the significance level to account for multiple comparisons, reducing the chance of Type I errors (false positives).


- **ScheffĂ©’s Test**: A more conservative post hoc test, especially useful when comparing all possible contrasts between means, not just pairwise comparisons.


These tests help provide a clearer picture of where the significant differences lie between the groups, beyond simply knowing that differences exist.


---


### **Readings** for this Unit:

1. **Levin and Fox**. (1969). *Analysis of Variance* (Chapter 8, pp. 283-308): This chapter provides an overview of the theory and application of ANOVA, focusing on how to conduct the analysis and interpret the results.

2. **Blalock, H.M.** (1969). *Analysis of Variance* (Chapter 16, pp. 317-360): This reading delves deeper into the mathematical foundation of ANOVA, offering a more comprehensive understanding of the statistical principles involved.


These readings will give you a solid foundation in understanding and applying ANOVA in sociological research, particularly when comparing group means. Let me know if you need further elaboration on any specific point!

Analysis of Interval- and Ratio-scale Data

Analysis of Interval- and Ratio-scale Data


### Unit IV: Analysis of Interval- and Ratio-scale Data


#### A. **Rationale**

Interval- and ratio-scale data allow for more sophisticated statistical analyses because both scales measure continuous variables. Interval data has meaningful intervals between values, but no true zero point (e.g., temperature in Celsius), while ratio data has a true zero (e.g., income, age). The rationale for analyzing such data is to gain deeper insights into relationships, patterns, and trends, making it possible to perform tests of significance and assess the strength and nature of relationships between variables. This allows researchers to make more precise and reliable inferences about populations.


---


#### B. **Univariate Data Analysis: One-Sample Z, t, and F Tests**


- **Z Test**: A statistical test used to determine whether the mean of a population is significantly different from a hypothesized value when the population variance is known and the sample size is large (n > 30).

  - Formula: 

    \[

    Z = \frac{\bar{X} - \mu}{\sigma / \sqrt{n}}

    \]

    Where:

    - \(\bar{X}\) = Sample mean

    - \(\mu\) = Population mean

    - \(\sigma\) = Population standard deviation

    - \(n\) = Sample size


- **t-Test**: Used when the population variance is unknown and the sample size is small (n < 30). It tests whether the sample mean is significantly different from a hypothesized population mean.

  - Formula:

    \[

    t = \frac{\bar{X} - \mu}{s / \sqrt{n}}

    \]

    Where:

    - \(s\) = Sample standard deviation (used instead of population standard deviation).


- **F Test**: Used to compare the variances of two populations or assess whether multiple group means differ significantly (ANOVA). This test is critical for understanding whether variability between groups is due to chance or a real difference.


---


#### C. **Bivariate Data Analysis**


- **Two-Way Frequency Table**: Similar to nominal data analysis, but in interval/ratio data, the emphasis is more on measuring the strength of the relationship between variables.


- **Scatter Diagram**: A graphical representation that plots two variables on a Cartesian plane. It helps in visualizing the relationship between two interval or ratio variables. The pattern in the scatter diagram provides clues about the direction and strength of the relationship.


- **Correlation Coefficient**: Measures the strength and direction of the relationship between two variables. The most common is **Pearson’s r**, which ranges from -1 to 1. A value close to 1 or -1 indicates a strong relationship, while a value near 0 indicates a weak or no relationship.

  - Formula for Pearson's r:

    \[

    r = \frac{n(\sum xy) - (\sum x)(\sum y)}{\sqrt{[n\sum x^2 - (\sum x)^2][n\sum y^2 - (\sum y)^2]}}

    \]


- **Simple Linear Regression**: A method for predicting the value of a dependent variable based on the value of an independent variable. It establishes a linear relationship between two variables.

  - Formula: 

    \[

    Y = a + bX

    \]

    Where:

    - \(Y\) = Dependent variable

    - \(X\) = Independent variable

    - \(a\) = Intercept

    - \(b\) = Slope (rate of change).


- **Two-Sample Z, t, and F Tests**: These are extensions of the one-sample tests, used when comparing two independent groups:

  - **Two-sample Z Test**: Compares the means of two independent samples when the population variances are known.

  - **Two-sample t-Test**: Used when population variances are unknown, and it tests whether two sample means differ significantly.

  - **Two-sample F Test**: Compares the variances of two independent samples.


- **Significance Tests of Correlation and Regression Coefficients**: These tests determine whether the observed correlation or regression coefficients are statistically significant. The hypothesis test checks if the correlation or slope coefficient is significantly different from zero, indicating a meaningful relationship between the variables.


---


#### D. **Interpretation**

The interpretation of these analyses involves understanding the meaning of the statistical output and its implications. For example:

- In correlation analysis, you interpret the direction (positive or negative) and strength of the relationship.

- In regression analysis, the slope coefficient (\(b\)) indicates the rate of change in the dependent variable for each unit change in the independent variable.

- In significance tests, p-values are used to determine whether the results are statistically significant. A p-value less than 0.05 typically indicates that the relationship or difference is not due to random chance.


---


#### E. **Inference**

Inferences from interval and ratio data analysis help researchers generalize their findings from a sample to the larger population. These tests allow you to make informed conclusions, such as predicting outcomes (e.g., predicting income based on education level), or understanding the strength and nature of relationships between variables in the population. Confidence intervals and hypothesis testing are essential for making these inferences reliable.


---


### **Readings** for this Unit:

1. **Blalock, H.M.** (1969). *Interval Scales: Frequency distribution and graphic presentation* (Chapter 4, pp. 41-54): This chapter covers the basics of summarizing interval-scale data using frequency distributions and visual methods like graphs.

2. **Blalock, H.M.** (1969). *Interval Scales: Measures of Central Tendency* (Chapter 5, pp. 55-76): This reading focuses on the measures of central tendency (mean, median, mode) for interval data.

3. **Blalock, H.M.** (1969). *Two Samples Test: Difference of Means and Proportions* (Chapter 13, pp. 219-242): This chapter explains how to test for significant differences between two samples.

4. **Levin and Fox**, *Elementary Statistics in Social Research*, Chapter 7: "Testing Differences between Means" (pp. 235-268): This reading explains various methods for testing mean differences between groups using z, t, and F tests.

5. **Blalock, H.M.** (1969). *Correlation and Regression* (Chapter 17, pp. 361-396): This chapter provides an in-depth understanding of correlation and regression analysis, crucial for analyzing interval and ratio data.

6. **Levin and Fox**, *Elementary Statistics in Social Research*, Chapters 10 and 11 (pp. 345-392): These chapters further elaborate on correlation and regression analysis, including testing for significance of relationships and interpreting regression coefficients.


These readings will guide you through the theoretical and practical aspects of analyzing interval and ratio-scale data in sociological research. Let me know if you'd like to explore any topic in more detail!


Popular Posts