Showing posts with label Variance. Show all posts

Logic Behind Analysis of Variance (ANOVA)

 Logic Behind Analysis of Variance (ANOVA)


## Logic Behind Analysis of Variance (ANOVA)


**Analysis of Variance (ANOVA)** is a statistical method used to test differences between two or more group means. The fundamental logic behind ANOVA is to assess whether the variability in the data can be attributed to the differences between the group means or if it is simply due to random chance.


### Key Concepts:

1. **Total Variability**: ANOVA partitions the total variability observed in the data into two components:

   - **Between-Group Variability**: This reflects the variation due to the interaction between the different groups being compared. It measures how much the group means differ from the overall mean.

   - **Within-Group Variability**: This reflects the variation within each group. It measures how much individual observations within each group differ from their respective group mean.


2. **F-Ratio**: ANOVA computes an F-ratio, which is the ratio of the variance between groups to the variance within groups. A higher F-ratio suggests that the variability between group means is greater than the variability within groups, indicating a significant difference among the group means.


3. **Hypothesis Testing**: The null hypothesis (H0) states that all group means are equal, while the alternative hypothesis (H1) states that at least one group mean is different. ANOVA tests these hypotheses by analyzing the F-ratio and determining the associated p-value.


## Differences Between ANOVA and T-Test


### Key Differences:

- **Number of Groups**: The most significant difference is that a t-test is used to compare the means of two groups, while ANOVA is used to compare the means of three or more groups.


- **Statistical Output**: A t-test produces a t-statistic and a corresponding p-value, while ANOVA produces an F-statistic and a p-value.


- **Complexity**: ANOVA can handle more complex experimental designs, including factorial designs, where multiple independent variables are analyzed simultaneously.


### When to Use Each:

- **T-Test**: Use when comparing the means of two groups (e.g., comparing test scores between two different teaching methods).


- **ANOVA**: Use when comparing the means of three or more groups (e.g., comparing test scores among three different teaching methods).


## Application of ANOVA in Sociological Research


ANOVA is particularly useful in sociological research when examining the effects of categorical independent variables on continuous dependent variables. Here are some situations where ANOVA would be appropriate:


1. **Comparing Group Differences**: When a researcher wants to compare the impact of different social programs on participants' outcomes (e.g., income levels across different training programs).


2. **Assessing Treatment Effects**: In experimental designs, ANOVA can be used to evaluate the effectiveness of multiple interventions (e.g., comparing the effectiveness of different community outreach strategies on public health).


3. **Analyzing Survey Data**: When analyzing survey responses from different demographic groups (e.g., comparing satisfaction levels across various age groups or income levels).


In summary, ANOVA is a powerful statistical tool that helps researchers determine whether significant differences exist among group means, making it essential for analyzing complex social phenomena in sociological research. It provides insights that can inform policy decisions and enhance understanding of social dynamics.


Citations:

[1] https://www.wallstreetmojo.com/anova-vs-t-test/

[2] https://keydifferences.com/difference-between-t-test-and-anova.html

[3] https://testbook.com/key-differences/difference-between-t-test-and-anova

[4] https://www.voxco.com/blog/anova-vs-t-test-with-a-comparison-chart/

[5] https://www.raybiotech.com/learning-center/t-test-anova/

[6] https://www.youtube.com/watch?v=4WtnVOAefPo

[7] https://www.ncbi.nlm.nih.gov/pmc/articles/PMC6813708/

[8] https://www.reddit.com/r/statistics/comments/12u4zgj/q_why_run_a_ttest_instead_of_an_oneway_anova/

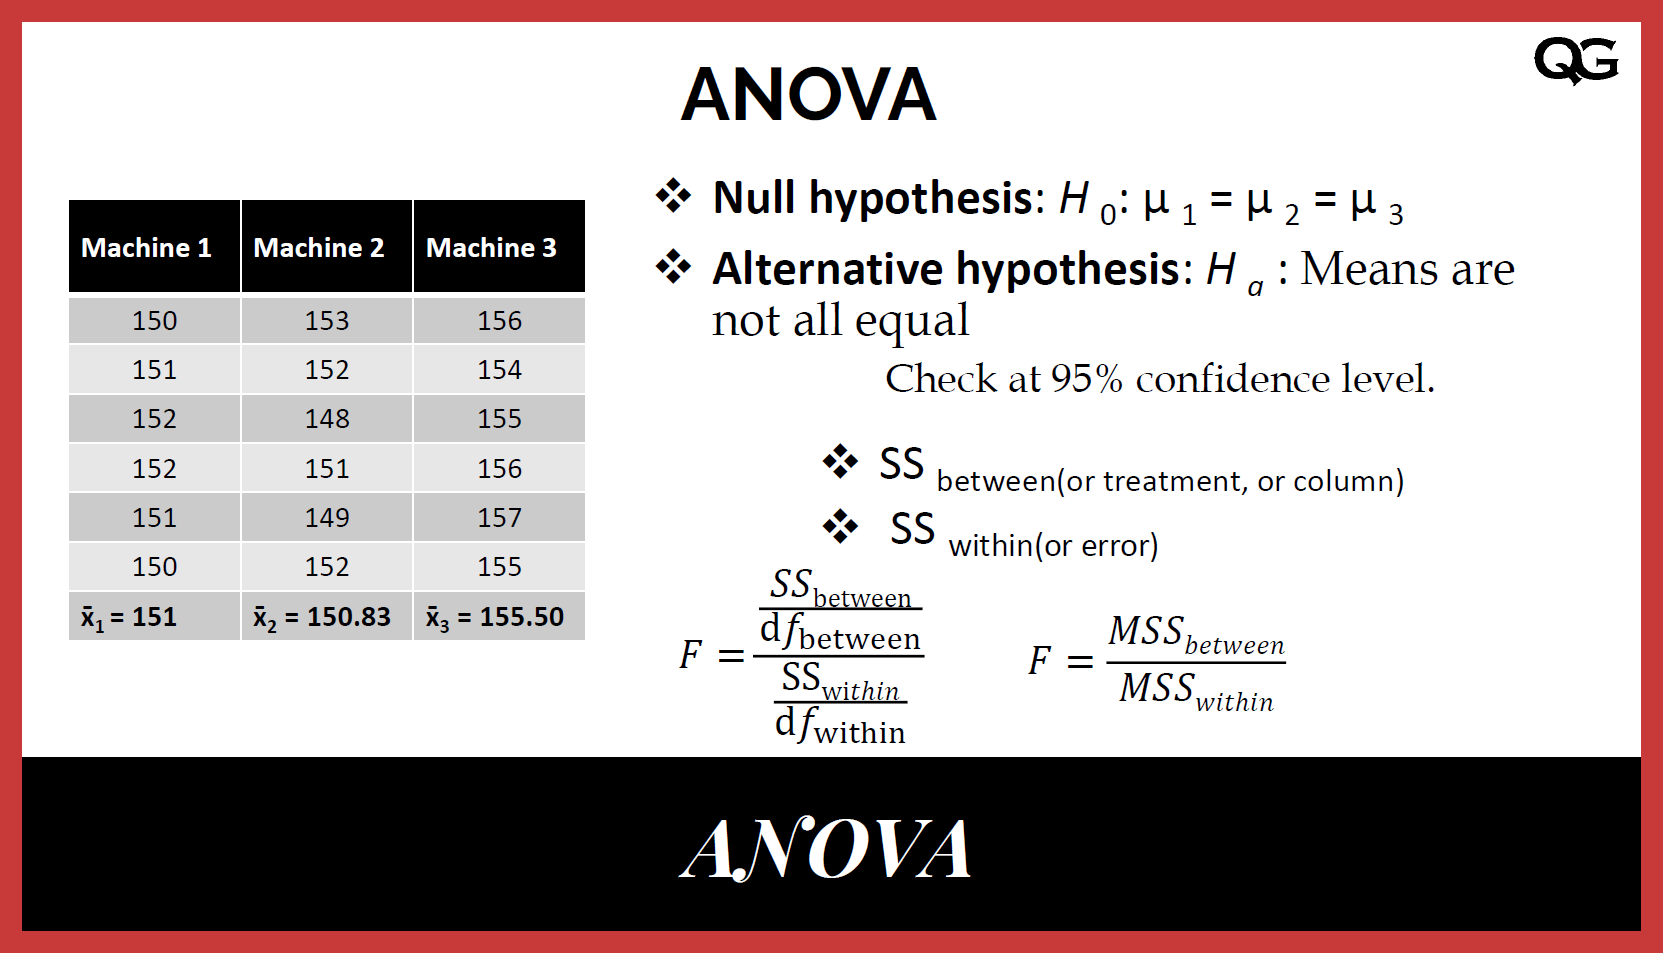
Analysis of Variance (ANOVA)

Analysis of Variance (ANOVA)


### Unit V: Analysis of Variance (ANOVA)


#### A. **The Logic of Analysis of Variance**

Analysis of Variance (ANOVA) is a statistical technique used to determine whether there are significant differences between the means of three or more groups. The key logic behind ANOVA is to test the hypothesis that all group means are equal, versus the alternative hypothesis that at least one group mean is different. 


ANOVA compares the variance within each group to the variance between the groups:

- **Within-group variance** measures how much individuals in the same group differ from the group mean.

- **Between-group variance** measures how much the group means differ from the overall mean.


If the between-group variance is significantly larger than the within-group variance, it suggests that the groups are not all the same, leading to the rejection of the null hypothesis.


The F-ratio is used in ANOVA to compare these variances:

\[

F = \frac{\text{Between-group variance}}{\text{Within-group variance}}

\]

If the F-ratio is large, it suggests that there is a significant difference between group means.


---


#### B. **Analysis of Variance**

ANOVA can be conducted for different types of data:

- **One-Way ANOVA**: Used when comparing the means of three or more independent groups on one factor. For example, you might compare the academic performance (measured by test scores) of students from three different educational methods.


  Steps in One-Way ANOVA:

  1. Calculate the **total variance** (the variance of all observations).

  2. Break down the total variance into **between-group variance** and **within-group variance**.

  3. Compute the **F-ratio**.

  4. Compare the F-ratio to a critical value from the F-distribution table, which depends on the number of groups and sample sizes. If the calculated F-ratio is larger than the critical value, the null hypothesis (that all group means are equal) is rejected.


- **Two-Way ANOVA**: Used when there are two independent variables, allowing the researcher to assess not only the main effects of each variable but also the interaction effect between the two variables. For instance, you might examine the effects of both gender and study method on academic performance.


---


#### C. **Multiple Comparison of Means**

After conducting ANOVA, if the null hypothesis is rejected, it indicates that at least one group mean is different, but it doesn’t specify which groups are significantly different. To determine which specific group means differ from each other, **multiple comparison tests** (also called post hoc tests) are used. Common methods include:


- **Tukey’s Honestly Significant Difference (HSD)**: Compares all possible pairs of means to identify which ones are significantly different.


- **Bonferroni Correction**: Adjusts the significance level to account for multiple comparisons, reducing the chance of Type I errors (false positives).


- **ScheffĂ©’s Test**: A more conservative post hoc test, especially useful when comparing all possible contrasts between means, not just pairwise comparisons.


These tests help provide a clearer picture of where the significant differences lie between the groups, beyond simply knowing that differences exist.


---


### **Readings** for this Unit:

1. **Levin and Fox**. (1969). *Analysis of Variance* (Chapter 8, pp. 283-308): This chapter provides an overview of the theory and application of ANOVA, focusing on how to conduct the analysis and interpret the results.

2. **Blalock, H.M.** (1969). *Analysis of Variance* (Chapter 16, pp. 317-360): This reading delves deeper into the mathematical foundation of ANOVA, offering a more comprehensive understanding of the statistical principles involved.


These readings will give you a solid foundation in understanding and applying ANOVA in sociological research, particularly when comparing group means. Let me know if you need further elaboration on any specific point!

Popular Posts