Key Statistical Concepts

 Key Statistical Concepts


### Unit I: Key Statistical Concepts


#### A. **Grouping and Organizing Data**

Grouping and organizing data is the foundation of statistical analysis. It involves structuring raw data into a manageable format, making it easier to interpret and analyze.


- **Grouping**: This refers to the process of categorizing or classifying data into different groups or classes based on certain characteristics. For example, income levels can be grouped into categories such as low, middle, and high income.

- **Organizing Data**: Once grouped, data is arranged in a structured way to facilitate analysis. This can involve creating frequency tables, charts, or graphs.


#### B. **Univariate, Bivariate, and Multivariate Data and Frequency Distribution**


- **Univariate Data**: This refers to the analysis of a single variable. For example, analyzing the average income of individuals in a dataset is a univariate analysis.

- **Bivariate Data**: Involves the analysis of two variables to determine relationships or correlations. For example, studying the relationship between income and education level.

- **Multivariate Data**: Involves three or more variables, often to explore more complex relationships. For example, analyzing how income, education, and gender together impact employment status.


**Frequency Distribution**: A table that displays the frequency or count of observations for each value or category of a variable. This is often used in univariate analysis to summarize data, and can be visualized through histograms or bar charts.


#### C. **Cross-Sectional, Cohort, and Panel Data**


- **Cross-Sectional Data**: Data collected at a single point in time across various subjects. It provides a snapshot of a population at a specific moment. For example, a survey measuring people's opinions on social issues in 2023.

- **Cohort Data**: A type of longitudinal data where a specific group (cohort) is followed over a period. This is useful for examining how a particular characteristic or event influences a group of people over time. For instance, tracking the educational progress of a group of students who started school in the same year.

- **Panel Data**: Also longitudinal, but it involves repeated observations of the same subjects at multiple time points. It allows researchers to observe changes over time for the same individuals, making it useful for identifying trends.


#### D. **Summarizing Data: Measures of Central Tendency and Dispersion**


- **Measures of Central Tendency**:

  - **Mean**: The average of all data points. It provides a general idea of the "central" value in a dataset.

  - **Median**: The middle value when data is ordered from lowest to highest. It is particularly useful in skewed distributions.

  - **Mode**: The most frequent value in a dataset. It is often used with categorical data.


- **Measures of Dispersion**:

  - **Range**: The difference between the highest and lowest values. It provides a basic sense of variability.

  - **Variance**: The average squared deviation from the mean, showing how much values differ from the mean.

  - **Standard Deviation**: The square root of variance, providing a measure of spread in the same units as the data. It indicates how much the data varies from the mean.


---


### **Readings** for this Unit:

- **Mueller, John H. and Karl F. Schuessler (1969)**, *Statistical Reasoning in Sociology*, New Delhi: Oxford and IBH. (Chapters 3, pp. 29-78): This reading focuses on the foundations of statistical reasoning and methods of summarizing sociological data.

- **Levin and Fox**, *Elementary Statistics in Social Research*: Chapter 2 (Grouping and organizing data), Chapter 3 (Univariate, bivariate, and multivariate data), and Chapter 4 (Summarizing data with central tendency and dispersion measures).

- **T.L. Baker**, *Doing Social Research*: Levels of measurement (pp. 119-125) and cross-sectional or longitudinal study designs (pp. 91-95).


These readings will provide you with theoretical and practical knowledge about key statistical concepts in sociological research. Let me know if you want more detailed explanations or summaries of any specific readings!

Basic Statistical Techniques in Sociological Research

 Basic Statistical Techniques in Sociological Research


### Objectives of the Course: Basic Statistical Techniques in Sociological Research


This course is designed to equip students with the essential skills for analyzing sociological data through basic statistical techniques. The course emphasizes understanding and applying various types of data measurement scales—nominal, ordinal, interval, and ratio—while developing proficiency in organizing and analyzing data. Below, we explore the specific objectives outlined in the course description.


---


### a) **Enable Students to Categorize and Organize Data**


#### Objective Breakdown:

One of the foundational aspects of sociological research is the ability to efficiently categorize and organize data. This objective aims to help students:

- Understand the nature of data collected in sociological research, which can come from surveys, interviews, experiments, or observational studies.

- Learn methods for sorting and classifying data to make analysis more streamlined and meaningful.

- Understand the role of variables and how to distinguish between different types of variables (e.g., independent, dependent, control).


#### Skills Developed:

- **Categorizing Data:** Learn how to distinguish and group variables into distinct categories based on their characteristics.

  - For example, in a survey of household income, data can be categorized by income brackets.

- **Data Organization:** Learn methods like coding, tabulation, and structuring datasets for effective analysis.

  - **Coding** allows for organizing qualitative responses into a format suitable for statistical analysis.

  - **Tabulation** enables students to summarize data in tables, making it easier to draw comparisons.


By achieving this objective, students will gain the ability to structure raw data in ways that are conducive to deeper statistical analysis, facilitating the application of different techniques based on the nature of the data.


---


### b) **Enable Students to Identify Nominal, Ordinal, Interval, and Ratio Scale Data**


#### Objective Breakdown:

Understanding the different types of data measurement scales is critical to choosing appropriate statistical methods. This objective ensures that students can:

- Recognize and differentiate between the four major scales of measurement: nominal, ordinal, interval, and ratio.

- Learn which statistical techniques are best suited for each scale of data.


#### Breakdown of Data Scales:

1. **Nominal Data**:

   - **Definition**: Data classified into distinct categories with no inherent order or ranking.

   - **Examples**: Gender (male, female), political affiliation (Democrat, Republican), ethnicity.

   - **Statistical Methods**: Frequencies, mode, chi-square test, contingency tables.


2. **Ordinal Data**:

   - **Definition**: Data that is placed into categories with a meaningful order, but the differences between the categories are not measurable.

   - **Examples**: Socioeconomic status (low, middle, high), education level (primary, secondary, higher), Likert scale responses (agree, neutral, disagree).

   - **Statistical Methods**: Median, percentile ranks, Spearman’s rank correlation.


3. **Interval Data**:

   - **Definition**: Data with meaningful intervals between values, but no true zero point (zero does not indicate absence).

   - **Examples**: Temperature in Celsius, IQ scores, calendar years.

   - **Statistical Methods**: Mean, standard deviation, t-tests, correlation, ANOVA.


4. **Ratio Data**:

   - **Definition**: Data with all the properties of interval data, but with a true zero point, allowing for comparisons of absolute magnitude.

   - **Examples**: Income, age, height, weight, time.

   - **Statistical Methods**: Geometric mean, ratio analysis, regression, ANOVA.


#### Skills Developed:

- Learn how to categorize data based on its measurement scale.

- Understand which scale is appropriate for specific kinds of sociological questions.

- Practice determining the level of measurement in different datasets.


By mastering this objective, students will be able to distinguish between various data types, ensuring the correct application of statistical techniques to enhance the accuracy of their analysis.


---


### c) **Develop Skills of Analyzing Nominal, Ordinal, Interval, and Ratio Scale Data**


#### Objective Breakdown:

Building on the ability to identify different data scales, this objective emphasizes the development of analytical skills specific to each type of data. Students will learn the following:

- **Statistical techniques** for analyzing nominal, ordinal, interval, and ratio data.

- **Interpretation of results**, allowing students to draw meaningful sociological conclusions from their data.


#### Analysis by Scale Type:

1. **Nominal Data Analysis**:

   - Since nominal data consists of categorical variables without order, students will focus on frequency counts and cross-tabulations to understand distributions.

   - **Key Tools**: Bar charts, pie charts, mode, chi-square tests.


2. **Ordinal Data Analysis**:

   - Ordinal data allows for ranking, so students will learn to apply non-parametric statistical methods (which do not assume normal distribution).

   - **Key Tools**: Median, interquartile range (IQR), rank correlation, Mann-Whitney U test, Wilcoxon signed-rank test.


3. **Interval Data Analysis**:

   - Interval data analysis includes parametric methods, as this data allows for measuring distances between points.

   - **Key Tools**: Mean, standard deviation, correlation, t-tests (for comparing two groups), ANOVA (for comparing three or more groups).


4. **Ratio Data Analysis**:

   - Ratio data, which includes a true zero, allows for the most complex forms of analysis, including ratio comparisons and proportional measures.

   - **Key Tools**: Mean, geometric mean, regression analysis (for predicting dependent variables), ANOVA, and advanced statistical modeling.


#### Skills Developed:

- Ability to apply both **descriptive statistics** (summarizing data) and **inferential statistics** (making predictions and inferences from sample data).

- Understand the assumptions behind different statistical tests, particularly parametric vs. non-parametric methods.

- Develop the capacity to analyze data sets in research scenarios using statistical software like SPSS, R, or Excel.


By achieving this objective, students will gain the necessary skills to perform rigorous data analysis across a variety of contexts, preparing them to tackle complex sociological research questions using data-driven approaches.


---


### Conclusion


By the end of this course, students will be well-equipped with the skills needed to categorize, organize, and analyze sociological data using appropriate statistical techniques. They will have a clear understanding of the distinctions between nominal, ordinal, interval, and ratio data, and they will be able to choose and apply the right methods for analyzing each type of data. These skills are crucial for conducting sociological research and interpreting real-world data effectively, laying the groundwork for higher-level analysis in future studies or professional work.

Basic Statistics in Sociological Research

 Basic Statistics in Sociological Research


### Basic Statistics in Sociological Research


In sociological research, statistics play a fundamental role in analyzing data, uncovering patterns, and making generalizations about social behaviors, structures, and processes. Basic statistical methods allow sociologists to summarize large sets of data, determine relationships between variables, and make informed decisions based on empirical evidence. Below is an overview of key statistical concepts and techniques commonly used in sociological research:


### 1. **Descriptive Statistics**


Descriptive statistics summarize or describe the main features of a dataset. They provide an overview of the data through measures of central tendency, dispersion, and frequency distribution. The primary tools of descriptive statistics include:


#### a. **Measures of Central Tendency**

These measures indicate the central or typical value in a dataset:

   - **Mean (Arithmetic Average):** The sum of all values divided by the number of observations. The mean is useful for understanding the overall trend in data, but it is sensitive to extreme values (outliers).

   - **Median:** The middle value when data are arranged in ascending or descending order. The median is particularly useful when dealing with skewed data or outliers, as it gives a better sense of the "middle" without being affected by extreme values.

   - **Mode:** The most frequent value in a dataset. The mode is used in categorical data or when you need to identify the most common response or outcome in a dataset.


#### b. **Measures of Dispersion (Variability)**

These measures assess how spread out the data are:

   - **Range:** The difference between the highest and lowest values in the dataset. While easy to compute, the range can be influenced heavily by outliers.

   - **Variance:** The average of the squared differences from the mean. It gives a sense of how much individual data points deviate from the mean.

   - **Standard Deviation:** The square root of the variance, providing a measure of dispersion in the same units as the data. A low standard deviation means that data points tend to be close to the mean, while a high standard deviation indicates greater variability.

   - **Interquartile Range (IQR):** The range of the middle 50% of the data, calculated as the difference between the 75th percentile (Q3) and the 25th percentile (Q1). It is resistant to outliers and useful for comparing the spread of different datasets.


#### c. **Frequency Distribution**

Frequency distribution describes how often different values or categories occur in a dataset. Sociologists often use tables, histograms, or bar charts to represent frequency distributions, allowing them to visualize patterns and trends in data, especially in categorical or ordinal data.


### 2. **Inferential Statistics**


While descriptive statistics help summarize data, **inferential statistics** allow sociologists to make generalizations or inferences about a population based on a sample. Inferential statistics involve hypothesis testing, estimation, and determining the likelihood that a result found in a sample applies to the larger population.


#### a. **Sampling**

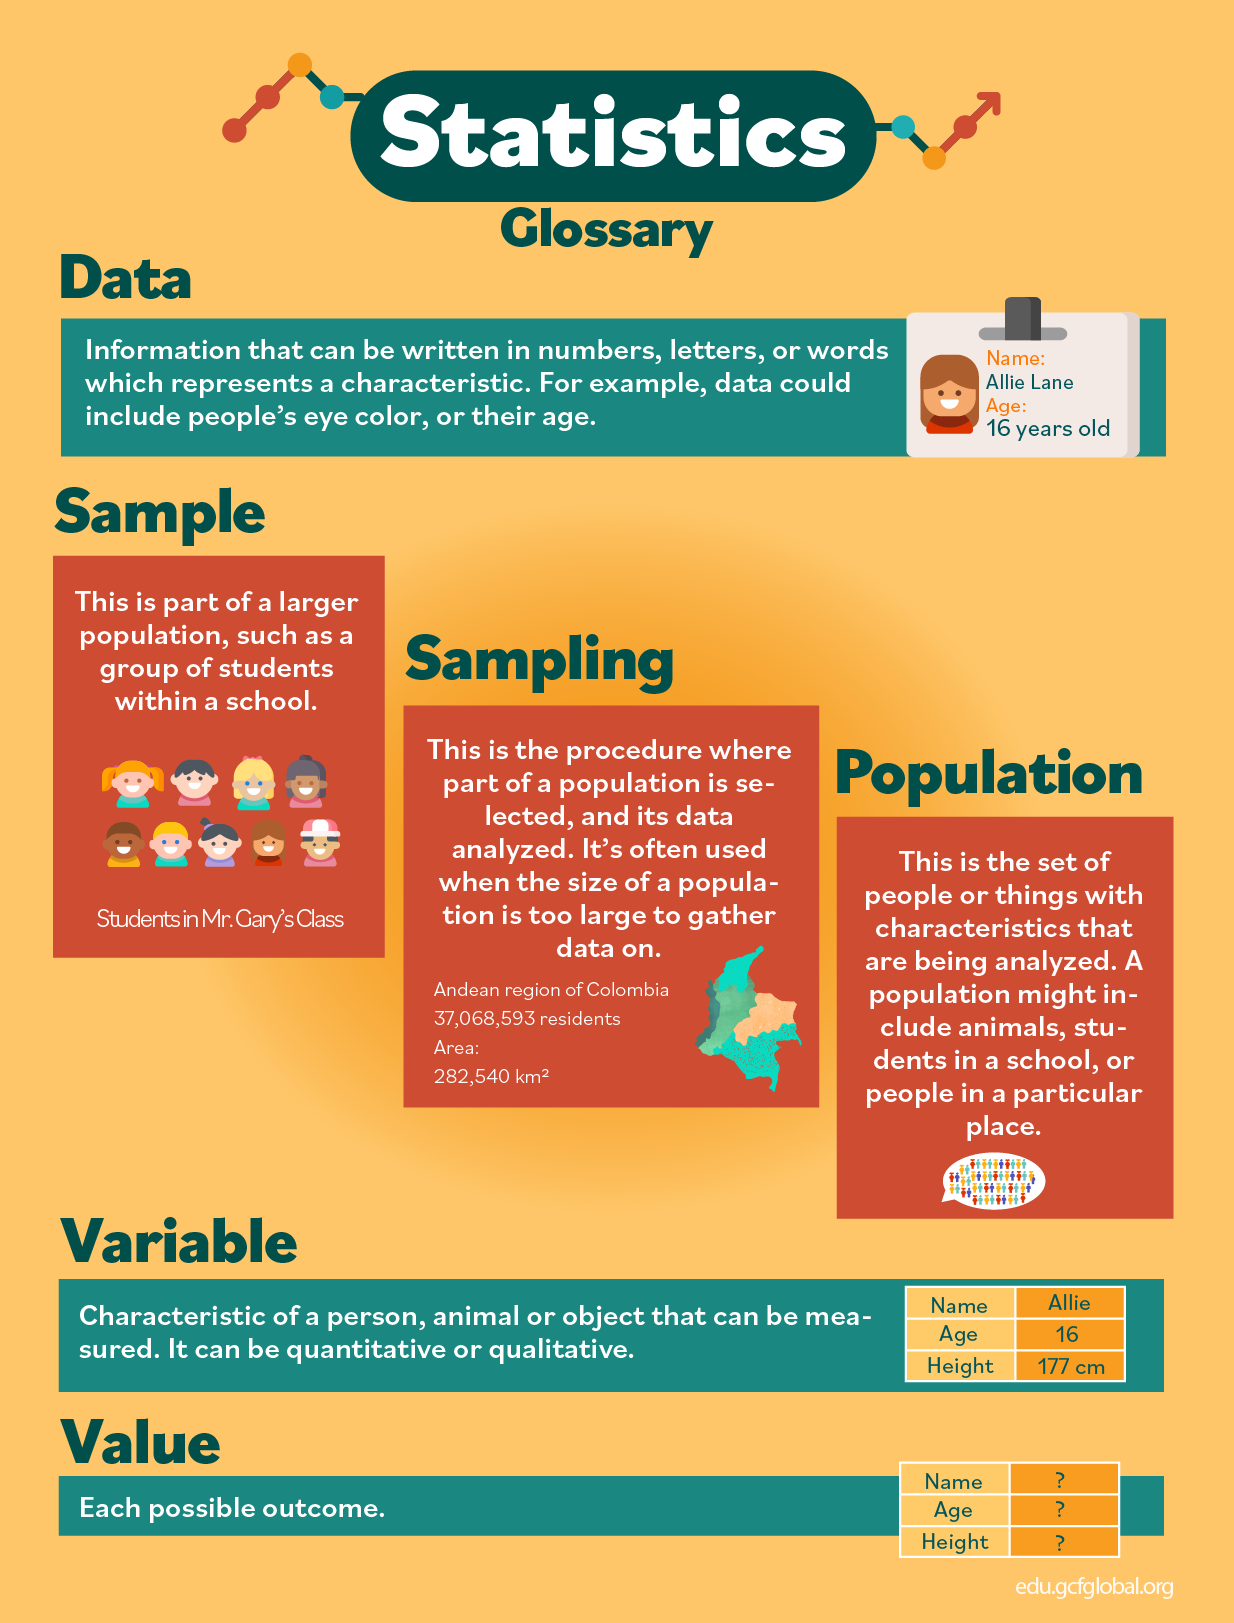
Sociological research often deals with large populations, making it impossible to collect data from every individual. A **sample** is a subset of the population, and **sampling methods** (e.g., random sampling, stratified sampling, convenience sampling) are used to select participants. In inferential statistics, the goal is to make conclusions about the broader population from the sample data.


#### b. **Hypothesis Testing**

Hypothesis testing involves making claims about a population parameter (such as the mean) and using sample data to test these claims. The basic steps are:

   - **Null Hypothesis (H₀):** A statement that there is no effect or no relationship between variables. For example, "There is no relationship between education level and income."

   - **Alternative Hypothesis (H₁):** A statement that contradicts the null hypothesis, suggesting an effect or relationship exists. For example, "Higher education levels lead to higher income."

   - **Significance Level (α):** A threshold (often 0.05) that determines when to reject the null hypothesis. If the p-value (probability of obtaining the observed results under the null hypothesis) is lower than α, the null hypothesis is rejected.

   - **Type I and Type II Errors:** A **Type I error** occurs when the null hypothesis is wrongly rejected (false positive), while a **Type II error** occurs when the null hypothesis is not rejected despite being false (false negative).


#### c. **T-tests and ANOVA**

   - **T-test:** Used to compare the means of two groups to determine if they are statistically different. For instance, it can be used to test whether the mean income of men differs significantly from that of women.

   - **Analysis of Variance (ANOVA):** An extension of the t-test, ANOVA is used when comparing the means of three or more groups. For example, sociologists can use ANOVA to examine whether educational achievement varies across different socioeconomic groups.


#### d. **Correlation and Regression**

   - **Correlation:** A statistical measure (denoted as 'r') that describes the strength and direction of a relationship between two variables. Correlations can range from -1 to +1, where +1 indicates a perfect positive relationship, -1 indicates a perfect negative relationship, and 0 indicates no relationship.

   - **Regression Analysis:** A more advanced statistical tool used to understand the relationship between an independent variable (predictor) and a dependent variable (outcome). Simple linear regression models the relationship between two variables, while multiple regression considers the influence of several independent variables on a dependent variable.


### 3. **Bivariate and Multivariate Analysis**


Sociologists are often interested in relationships between two or more variables:


#### a. **Bivariate Analysis**

This involves examining the relationship between two variables. The most common methods include:

   - **Cross-tabulation (Contingency Table):** A table that shows the frequency distribution of two categorical variables. Sociologists use cross-tabulation to explore how one variable is distributed across levels of another, such as how political party affiliation varies by age group.

   - **Chi-Square Test:** A statistical test used to determine whether there is a significant association between two categorical variables.


#### b. **Multivariate Analysis**

Multivariate analysis involves examining relationships between three or more variables simultaneously. Techniques such as **multiple regression** or **factor analysis** help sociologists understand the complex interrelationships among variables and control for confounding factors.


### 4. **Using Statistics in Sociological Research**

Statistics are essential in sociological research for the following reasons:

   - **Objectivity and Precision:** Statistical methods provide an objective basis for testing hypotheses and identifying patterns, reducing the risk of researcher bias.

   - **Data Summarization:** Large datasets can be summarized and represented effectively through statistical tools, making complex social phenomena easier to understand.

   - **Predictive Analysis:** Statistical techniques such as regression help sociologists make predictions about social outcomes, like how certain factors (e.g., education, income, age) influence behaviors or trends.

   - **Policy and Decision Making:** Findings from sociological research often inform policymakers, and statistical analysis adds weight to the evidence provided.


### Conclusion

Basic statistics are an indispensable part of sociological research. From descriptive statistics that summarize data to inferential methods that allow researchers to draw conclusions about broader populations, statistical tools enable sociologists to analyze social phenomena scientifically. Understanding these basic concepts is crucial for designing studies, analyzing data, and interpreting research findings in a meaningful way.

Action Plan for Research Using the World-System Perspective

 Action Plan for Research Using the World-System Perspective


10. Action Plan for Research Using the World-System Perspective


Question: Outline a research plan that incorporates the world-system perspective to study a global-local issue relevant to Nepal. What theoretical and empirical methods would you employ to investigate this issue?

Relevant Topics: Research methodology based on Wallerstein’s world-system theory, group work agenda from the Action Plan unit.


### Research Plan: Labor Migration and Global Capitalism in Nepal


#### Research Topic

The study will investigate the relationship between labor migration and global capitalism in Nepal, focusing on how global economic forces shape migration patterns, the experiences of migrants, and the socio-economic impacts on local communities.


#### Objectives

1. To analyze the motivations behind labor migration from Nepal in the context of global capitalism.

2. To examine the policies and institutional mechanisms governing labor migration in Nepal.

3. To assess the socio-economic impacts of remittances on local communities and national development.

4. To explore the challenges faced by Nepali migrants in destination countries and the implications for their families back home.


### Theoretical Framework

This research will utilize **Wallerstein’s world-systems theory** as the primary theoretical framework. The theory will help to contextualize Nepal's labor migration within the broader capitalist world-system, emphasizing the core-periphery dynamics that influence migration patterns and economic relations.


#### Key Concepts

- **Core-Periphery Dynamics**: Understanding how Nepal, as a peripheral nation, is integrated into the global economy and how this affects labor migration.

- **Unequal Exchange**: Analyzing how the economic benefits of labor migration are distributed between core countries and Nepal.

- **Dependency**: Exploring how reliance on remittances may perpetuate economic dependency and underdevelopment in Nepal.


### Methodology


#### 1. **Theoretical Methods**

- **Literature Review**: Conduct a comprehensive review of existing literature on labor migration, global capitalism, and world-systems theory. This will include works by Wallerstein, as well as studies specific to Nepal, such as those by Bandita Sijapati and Amrita Limbu.

- **Conceptual Framework Development**: Develop a conceptual framework that integrates world-systems theory with the specific context of labor migration in Nepal.


#### 2. **Empirical Methods**

- **Qualitative Research**: 

  - **Interviews**: Conduct semi-structured interviews with key stakeholders, including migrant workers, their families, policymakers, and representatives from NGOs working on migration issues. This will provide insights into personal experiences and the impact of migration on families and communities.

  - **Focus Groups**: Organize focus group discussions with migrant communities to explore collective experiences and perceptions regarding migration and remittances.


- **Quantitative Research**:

  - **Surveys**: Design and distribute surveys to collect data on migration patterns, remittance flows, and socio-economic impacts on households. This data will help quantify the relationships between migration, remittances, and local development.

  - **Statistical Analysis**: Use statistical methods to analyze survey data, identifying trends and correlations related to labor migration and economic outcomes.


### Data Sources

- **Government Reports**: Analyze reports from the Nepalese government and international organizations regarding labor migration policies, remittance statistics, and economic data.

- **NGO Publications**: Utilize research and reports from NGOs focused on labor rights and migration in Nepal to understand the challenges faced by migrants.

- **Academic Journals**: Review scholarly articles that discuss labor migration, global capitalism, and their implications for development in Nepal.


### Expected Outcomes

1. **Comprehensive Understanding**: Provide a nuanced understanding of how global capitalism influences labor migration in Nepal and the socio-economic implications for migrants and their families.

2. **Policy Recommendations**: Develop recommendations for policymakers to improve labor migration governance, enhance protections for migrants, and maximize the developmental benefits of remittances.

3. **Contribution to Theory**: Contribute to the theoretical discourse on labor migration and global capitalism by applying world-systems theory to the specific context of Nepal.


### Timeline

- **Months 1-2**: Conduct literature review and develop conceptual framework.

- **Months 3-4**: Design research instruments (interviews, surveys) and obtain necessary approvals.

- **Months 5-6**: Conduct fieldwork (interviews, focus groups, surveys).

- **Months 7-8**: Analyze data and compile findings.

- **Months 9-10**: Write and disseminate research report.


### Conclusion

This research plan outlines a comprehensive approach to studying labor migration and global capitalism in Nepal through the lens of world-systems theory. By employing both qualitative and quantitative methods, the study aims to uncover the complexities of migration, the experiences of Nepali migrants, and the broader socio-economic implications for Nepal within the global capitalist framework.


Citations:

[1] http://www.eolss.net/sample-chapters/c04/e6-99a-36.pdf

[2] https://web.mit.edu/esd.83/www/notebook/WorldSystem.pdf

[3] https://en.wikipedia.org/wiki/World-systems_theory

[4] https://www.journals.uchicago.edu/doi/abs/10.1086/226431

[5] https://www.sciencedirect.com/topics/social-sciences/world-systems-theory

[6] https://www.sociopedia.co/post/world-systems-theory

[7] https://link.springer.com/referenceworkentry/10.1007/978-3-319-74336-3_372-1

[8] https://www.oxfordbibliographies.com/display/document/obo-9780199743292/obo-9780199743292-0272.xml


Popular Posts