Showing posts with label research. Show all posts

Comparison of Cross-Sectional, Cohort, and Panel Data in Sociological Research

Comparison of Cross-Sectional, Cohort, and Panel Data in Sociological Research


### Comparison of Cross-Sectional, Cohort, and Panel Data in Sociological Research


In sociological research, the choice of data type is crucial as it influences the research design, analysis, and interpretation of results. Cross-sectional, cohort, and panel data are three fundamental types of data, each with distinct characteristics, advantages, and applications. Below is a detailed comparison of these data types, along with examples of when each would be used in sociological research.


### Cross-Sectional Data


**Definition**: Cross-sectional data is collected at a single point in time, providing a snapshot of a population or phenomenon. Researchers analyze various variables simultaneously without any follow-up.


**Characteristics**:

- Data is collected from multiple subjects at one time.

- Useful for identifying patterns, associations, and prevalence of characteristics within a population.

- Quick and cost-effective to gather.


**Example of Use**: A sociologist might conduct a cross-sectional study to assess the relationship between social media usage and anxiety levels among teenagers. By surveying a diverse group of teenagers at one time, the researcher can identify trends and correlations but cannot establish causality.


**Situations for Use**:

- When the research objective is to understand the current status or prevalence of a phenomenon.

- To generate hypotheses for further research.

- In studies where time constraints or budget limitations exist.


### Cohort Data


**Definition**: Cohort data involves tracking a specific group of individuals (a cohort) who share a common characteristic or experience over time. This data type allows researchers to observe changes and developments within that group.


**Characteristics**:

- Focuses on a specific cohort, such as individuals born in the same year or those who experienced a particular event (e.g., graduating from college).

- Data can be collected at multiple time points, allowing for longitudinal analysis of the cohort.


**Example of Use**: A researcher might study the long-term effects of childhood obesity by following a cohort of children from ages 5 to 25. By measuring various health outcomes at different ages, the researcher can analyze trends and impacts over time.


**Situations for Use**:

- When researchers want to study the effects of a specific event or experience on a group over time.

- To understand generational differences or trends.

- In studies that require tracking changes in health, behavior, or attitudes within a defined group.


### Panel Data


**Definition**: Panel data, also known as longitudinal data, involves collecting data from the same subjects over multiple time periods. This allows researchers to analyze changes at the individual level while also comparing different individuals at the same time.


**Characteristics**:

- Combines elements of both cross-sectional and time series data.

- Enables the analysis of dynamic changes and causal relationships.

- Can control for unobserved variables that do not change over time within subjects.


**Example of Use**: A sociologist studying the impact of a new educational policy might collect data on student performance, attendance, and demographic information from the same group of students over several years. This allows for observing how individual performance evolves in response to the policy.


**Situations for Use**:

- When researchers aim to analyze changes over time and establish causal relationships.

- To control for individual-level variability and unobserved heterogeneity.

- In studies requiring detailed insights into the dynamics of social phenomena.


### Summary of Differences


| Feature               | Cross-Sectional Data                      | Cohort Data                           | Panel Data                               |

|-----------------------|-------------------------------------------|---------------------------------------|------------------------------------------|

| **Data Collection**   | Single time point                         | Multiple time points for a cohort    | Multiple time points for the same individuals |

| **Focus**             | Snapshot of a population                  | Specific group over time              | Changes within individuals over time     |

| **Analysis Type**     | Correlational, descriptive                | Longitudinal, trend analysis          | Dynamic analysis, causal relationships    |

| **Cost and Time**     | Quick and cost-effective                  | More time-consuming and costly        | Most complex and resource-intensive      |

| **Causality**         | Cannot establish causality                | Can suggest causal links              | Can establish causal relationships       |


### Conclusion


Choosing between cross-sectional, cohort, and panel data depends on the research questions, objectives, and available resources. Cross-sectional data is ideal for quick assessments and hypothesis generation, cohort data is suitable for studying specific groups over time, and panel data provides in-depth insights into individual changes and causal relationships. Understanding these differences allows sociologists to design effective studies that yield meaningful and actionable insights into social phenomena.


Citations:

[1] https://quickonomics.com/terms/panel-data/

[2] https://www.geeksforgeeks.org/exploring-panel-datasets-definition-characteristics-advantages-and-applications/

[3] https://researcher.life/blog/article/what-is-a-cross-sectional-study-definition-and-examples/

[4] https://easyreadernews.com/cross-sectional-study-definition-meaning-and-characteristics/

[5] https://www.surveylab.com/blog/cross-sectional-data/

[6] https://www.questionpro.com/blog/cross-sectional-data/

[7] https://www.oxfordbibliographies.com/display/document/obo-9780199756384/obo-9780199756384-0104.xml

[8] https://www.aptech.com/blog/introduction-to-the-fundamentals-of-panel-data/


Basic Statistics in Sociological Research

Basic Statistics in Sociological Research


## Basic Statistics in Sociological Research


Statistics play a crucial role in sociological research, providing the tools necessary for analyzing social phenomena, understanding human behavior, and informing policy decisions. This overview will cover the fundamental concepts of statistics as applied in sociological contexts, the types of statistics used, and the significance of statistical methods in social research.


### Understanding Statistics in Sociology


Statistics in sociology can be broadly categorized into two types: **descriptive statistics** and **inferential statistics**.


- **Descriptive Statistics**: These statistics summarize and describe the characteristics of a dataset. Common measures include:

  - **Mean**: The average value.

  - **Median**: The middle value when data is ordered.

  - **Mode**: The most frequently occurring value.

  - **Standard Deviation**: A measure of the amount of variation or dispersion in a set of values.


Descriptive statistics are essential for providing a clear picture of the data at hand, allowing researchers to present findings in a comprehensible manner.


- **Inferential Statistics**: This type involves making predictions or inferences about a population based on a sample of data. It includes:

  - **Hypothesis Testing**: Determining whether there is enough evidence to support a specific hypothesis.

  - **Confidence Intervals**: Estimating the range within which a population parameter lies with a certain level of confidence.

  - **Regression Analysis**: Exploring relationships between variables to predict outcomes.


Inferential statistics are vital for generalizing findings from a sample to a broader population, enabling sociologists to draw conclusions that can inform social policies and interventions.


### The Role of Social Statistics


Social statistics are employed to study various aspects of human behavior and societal structures. They help answer critical questions such as:


- How do socioeconomic factors influence educational attainment?

- What is the relationship between income levels and health outcomes?

- How do demographic changes affect community dynamics?


By employing statistical methods, sociologists can analyze trends, test theories, and evaluate the impact of policies on different social groups. For instance, social statistics can be used to assess the effectiveness of welfare programs by comparing poverty rates before and after implementation[2].


### Data Collection and Analysis


The process of statistical analysis in sociological research involves several key steps:


1. **Planning and Designing**: Researchers must define their research questions clearly and design a study that will effectively address these questions. This includes selecting appropriate methodologies (e.g., surveys, experiments, observational studies).


2. **Data Collection**: This involves gathering data through various means such as surveys, interviews, or existing databases. The choice of data collection method can significantly impact the quality of the data obtained.


3. **Data Analysis**: Once data is collected, statistical software (e.g., SPSS, R) is often used to perform analyses. This step includes applying descriptive and inferential statistical techniques to interpret the data and draw conclusions.


4. **Reporting Findings**: The results of the analysis are then reported, often including visual representations such as graphs and tables to enhance understanding.


### Importance of Statistical Literacy


Statistical literacy is crucial for sociologists and social researchers. A solid understanding of statistical concepts enables researchers to design effective studies, analyze data accurately, and interpret results responsibly. Misapplication of statistical methods can lead to erroneous conclusions, which may have significant ethical implications in social research[5].


### Conclusion


Basic statistics are foundational to sociological research, providing the necessary tools for understanding complex social dynamics. By utilizing both descriptive and inferential statistics, sociologists can analyze data effectively, draw meaningful conclusions, and contribute to the development of informed social policies. As the field of sociology continues to evolve, the importance of statistical literacy and the application of robust statistical methods will remain paramount in addressing the challenges faced by societies today.


Citations:

[1] https://www.wiley.com/en-us/Basic%2BStatistics%2Bfor%2BSocial%2BResearch-p-9781118234150

[2] https://www.socialsciences.manchester.ac.uk/social-statistics/about/what-is-social-statistics/

[3] https://books.google.com/books/about/Basic_Statistics_for_Social_Research.html?id=ySxjvXKFRVMC

[4] https://the-sra.org.uk/SRA/Shared_Content/Events/Event_display.aspx?EventKey=BSASR19

[5] https://www.ncbi.nlm.nih.gov/pmc/articles/PMC5037948/

[6] https://www.youtube.com/watch?v=MNE4he4A8KY

[7] https://www.thoughtco.com/introduction-to-statistics-3026701

[8] https://www.amazon.com/Statistics-Social-Research-Robert-Hanneman/dp/0470587989

Basic Statistics in Sociological Research Important Questions

 Basic Statistics in Sociological Research Important Questions


Here are 10 important questions that cover the key concepts from all the units you've studied so far. These questions will help you prepare for your exams, focusing on both theoretical understanding and practical application:


### **Unit I: Key Statistical Concepts**


1. **Explain the differences between univariate, bivariate, and multivariate data. Provide examples of how each type can be used in sociological research.**

   - This question tests your understanding of different data types and their applications.


2. **Discuss the importance of summarizing data through measures of central tendency and measures of dispersion. How do mean, median, mode, range, variance, and standard deviation help in sociological analysis?**

   - This will require you to explain the significance of these statistical measures and how they are applied.


3. **Compare and contrast cross-sectional, cohort, and panel data. In what situations would each type be used in sociological research?**

   - This question focuses on different research designs and when to use each.


---


### **Unit II: Analysis of Nominal-scale Data**


4. **What is the rationale for analyzing nominal-scale data? How are proportions, percentages, and ratios used in nominal-scale analysis?**

   - You need to explain the reasoning behind nominal-scale data analysis and its practical application.


5. **Explain how the chi-square test is used in bivariate analysis of nominal-scale data. What is the role of the level of significance in this analysis?**

   - This will test your understanding of the chi-square test and significance levels in sociological research.


---


### **Unit III: Analysis of Ordinal-scale Data**


6. **Discuss the rationale for analyzing ordinal-scale data. How do you interpret the results of a rank correlation coefficient?**

   - This question focuses on the rationale for ordinal data analysis and the interpretation of rank correlation.


---


### **Unit IV: Analysis of Interval- and Ratio-scale Data**


7. **What is the difference between a one-sample Z test, t-test, and F test? In what research situations would you use each?**

   - This question tests your knowledge of the different tests for interval and ratio data and their applications.


8. **Explain the concept of a scatter diagram and correlation coefficient. How would you interpret a Pearson's correlation coefficient in a sociological study?**

   - This requires you to explain and apply the concept of correlation to real-world sociological research.


---


### **Unit V: Analysis of Variance (ANOVA)**


9. **What is the logic behind Analysis of Variance (ANOVA)? How does ANOVA differ from a t-test, and when would you use ANOVA in sociological research?**

   - This question will assess your understanding of the fundamental logic of ANOVA and its comparison to other statistical tests.


10. **After conducting ANOVA, why is it necessary to perform multiple comparison tests? Describe Tukey's HSD and how it is used to interpret the results of ANOVA.**

   - This will test your understanding of post-hoc tests and their importance after ANOVA.


---


These questions cover a wide range of statistical concepts, including data types, analysis techniques, and interpretation, all essential for your sociology exams. Let me know if you need any additional explanations or practice questions!

Basic Statistical Techniques in Sociological Research

 Basic Statistical Techniques in Sociological Research


### Objectives of the Course: Basic Statistical Techniques in Sociological Research


This course is designed to equip students with the essential skills for analyzing sociological data through basic statistical techniques. The course emphasizes understanding and applying various types of data measurement scales—nominal, ordinal, interval, and ratio—while developing proficiency in organizing and analyzing data. Below, we explore the specific objectives outlined in the course description.


---


### a) **Enable Students to Categorize and Organize Data**


#### Objective Breakdown:

One of the foundational aspects of sociological research is the ability to efficiently categorize and organize data. This objective aims to help students:

- Understand the nature of data collected in sociological research, which can come from surveys, interviews, experiments, or observational studies.

- Learn methods for sorting and classifying data to make analysis more streamlined and meaningful.

- Understand the role of variables and how to distinguish between different types of variables (e.g., independent, dependent, control).


#### Skills Developed:

- **Categorizing Data:** Learn how to distinguish and group variables into distinct categories based on their characteristics.

  - For example, in a survey of household income, data can be categorized by income brackets.

- **Data Organization:** Learn methods like coding, tabulation, and structuring datasets for effective analysis.

  - **Coding** allows for organizing qualitative responses into a format suitable for statistical analysis.

  - **Tabulation** enables students to summarize data in tables, making it easier to draw comparisons.


By achieving this objective, students will gain the ability to structure raw data in ways that are conducive to deeper statistical analysis, facilitating the application of different techniques based on the nature of the data.


---


### b) **Enable Students to Identify Nominal, Ordinal, Interval, and Ratio Scale Data**


#### Objective Breakdown:

Understanding the different types of data measurement scales is critical to choosing appropriate statistical methods. This objective ensures that students can:

- Recognize and differentiate between the four major scales of measurement: nominal, ordinal, interval, and ratio.

- Learn which statistical techniques are best suited for each scale of data.


#### Breakdown of Data Scales:

1. **Nominal Data**:

   - **Definition**: Data classified into distinct categories with no inherent order or ranking.

   - **Examples**: Gender (male, female), political affiliation (Democrat, Republican), ethnicity.

   - **Statistical Methods**: Frequencies, mode, chi-square test, contingency tables.


2. **Ordinal Data**:

   - **Definition**: Data that is placed into categories with a meaningful order, but the differences between the categories are not measurable.

   - **Examples**: Socioeconomic status (low, middle, high), education level (primary, secondary, higher), Likert scale responses (agree, neutral, disagree).

   - **Statistical Methods**: Median, percentile ranks, Spearman’s rank correlation.


3. **Interval Data**:

   - **Definition**: Data with meaningful intervals between values, but no true zero point (zero does not indicate absence).

   - **Examples**: Temperature in Celsius, IQ scores, calendar years.

   - **Statistical Methods**: Mean, standard deviation, t-tests, correlation, ANOVA.


4. **Ratio Data**:

   - **Definition**: Data with all the properties of interval data, but with a true zero point, allowing for comparisons of absolute magnitude.

   - **Examples**: Income, age, height, weight, time.

   - **Statistical Methods**: Geometric mean, ratio analysis, regression, ANOVA.


#### Skills Developed:

- Learn how to categorize data based on its measurement scale.

- Understand which scale is appropriate for specific kinds of sociological questions.

- Practice determining the level of measurement in different datasets.


By mastering this objective, students will be able to distinguish between various data types, ensuring the correct application of statistical techniques to enhance the accuracy of their analysis.


---


### c) **Develop Skills of Analyzing Nominal, Ordinal, Interval, and Ratio Scale Data**


#### Objective Breakdown:

Building on the ability to identify different data scales, this objective emphasizes the development of analytical skills specific to each type of data. Students will learn the following:

- **Statistical techniques** for analyzing nominal, ordinal, interval, and ratio data.

- **Interpretation of results**, allowing students to draw meaningful sociological conclusions from their data.


#### Analysis by Scale Type:

1. **Nominal Data Analysis**:

   - Since nominal data consists of categorical variables without order, students will focus on frequency counts and cross-tabulations to understand distributions.

   - **Key Tools**: Bar charts, pie charts, mode, chi-square tests.


2. **Ordinal Data Analysis**:

   - Ordinal data allows for ranking, so students will learn to apply non-parametric statistical methods (which do not assume normal distribution).

   - **Key Tools**: Median, interquartile range (IQR), rank correlation, Mann-Whitney U test, Wilcoxon signed-rank test.


3. **Interval Data Analysis**:

   - Interval data analysis includes parametric methods, as this data allows for measuring distances between points.

   - **Key Tools**: Mean, standard deviation, correlation, t-tests (for comparing two groups), ANOVA (for comparing three or more groups).


4. **Ratio Data Analysis**:

   - Ratio data, which includes a true zero, allows for the most complex forms of analysis, including ratio comparisons and proportional measures.

   - **Key Tools**: Mean, geometric mean, regression analysis (for predicting dependent variables), ANOVA, and advanced statistical modeling.


#### Skills Developed:

- Ability to apply both **descriptive statistics** (summarizing data) and **inferential statistics** (making predictions and inferences from sample data).

- Understand the assumptions behind different statistical tests, particularly parametric vs. non-parametric methods.

- Develop the capacity to analyze data sets in research scenarios using statistical software like SPSS, R, or Excel.


By achieving this objective, students will gain the necessary skills to perform rigorous data analysis across a variety of contexts, preparing them to tackle complex sociological research questions using data-driven approaches.


---


### Conclusion


By the end of this course, students will be well-equipped with the skills needed to categorize, organize, and analyze sociological data using appropriate statistical techniques. They will have a clear understanding of the distinctions between nominal, ordinal, interval, and ratio data, and they will be able to choose and apply the right methods for analyzing each type of data. These skills are crucial for conducting sociological research and interpreting real-world data effectively, laying the groundwork for higher-level analysis in future studies or professional work.

Basic Statistics in Sociological Research

 Basic Statistics in Sociological Research


### Basic Statistics in Sociological Research


In sociological research, statistics play a fundamental role in analyzing data, uncovering patterns, and making generalizations about social behaviors, structures, and processes. Basic statistical methods allow sociologists to summarize large sets of data, determine relationships between variables, and make informed decisions based on empirical evidence. Below is an overview of key statistical concepts and techniques commonly used in sociological research:


### 1. **Descriptive Statistics**


Descriptive statistics summarize or describe the main features of a dataset. They provide an overview of the data through measures of central tendency, dispersion, and frequency distribution. The primary tools of descriptive statistics include:


#### a. **Measures of Central Tendency**

These measures indicate the central or typical value in a dataset:

   - **Mean (Arithmetic Average):** The sum of all values divided by the number of observations. The mean is useful for understanding the overall trend in data, but it is sensitive to extreme values (outliers).

   - **Median:** The middle value when data are arranged in ascending or descending order. The median is particularly useful when dealing with skewed data or outliers, as it gives a better sense of the "middle" without being affected by extreme values.

   - **Mode:** The most frequent value in a dataset. The mode is used in categorical data or when you need to identify the most common response or outcome in a dataset.


#### b. **Measures of Dispersion (Variability)**

These measures assess how spread out the data are:

   - **Range:** The difference between the highest and lowest values in the dataset. While easy to compute, the range can be influenced heavily by outliers.

   - **Variance:** The average of the squared differences from the mean. It gives a sense of how much individual data points deviate from the mean.

   - **Standard Deviation:** The square root of the variance, providing a measure of dispersion in the same units as the data. A low standard deviation means that data points tend to be close to the mean, while a high standard deviation indicates greater variability.

   - **Interquartile Range (IQR):** The range of the middle 50% of the data, calculated as the difference between the 75th percentile (Q3) and the 25th percentile (Q1). It is resistant to outliers and useful for comparing the spread of different datasets.


#### c. **Frequency Distribution**

Frequency distribution describes how often different values or categories occur in a dataset. Sociologists often use tables, histograms, or bar charts to represent frequency distributions, allowing them to visualize patterns and trends in data, especially in categorical or ordinal data.


### 2. **Inferential Statistics**


While descriptive statistics help summarize data, **inferential statistics** allow sociologists to make generalizations or inferences about a population based on a sample. Inferential statistics involve hypothesis testing, estimation, and determining the likelihood that a result found in a sample applies to the larger population.


#### a. **Sampling**

Sociological research often deals with large populations, making it impossible to collect data from every individual. A **sample** is a subset of the population, and **sampling methods** (e.g., random sampling, stratified sampling, convenience sampling) are used to select participants. In inferential statistics, the goal is to make conclusions about the broader population from the sample data.


#### b. **Hypothesis Testing**

Hypothesis testing involves making claims about a population parameter (such as the mean) and using sample data to test these claims. The basic steps are:

   - **Null Hypothesis (H₀):** A statement that there is no effect or no relationship between variables. For example, "There is no relationship between education level and income."

   - **Alternative Hypothesis (H₁):** A statement that contradicts the null hypothesis, suggesting an effect or relationship exists. For example, "Higher education levels lead to higher income."

   - **Significance Level (α):** A threshold (often 0.05) that determines when to reject the null hypothesis. If the p-value (probability of obtaining the observed results under the null hypothesis) is lower than α, the null hypothesis is rejected.

   - **Type I and Type II Errors:** A **Type I error** occurs when the null hypothesis is wrongly rejected (false positive), while a **Type II error** occurs when the null hypothesis is not rejected despite being false (false negative).


#### c. **T-tests and ANOVA**

   - **T-test:** Used to compare the means of two groups to determine if they are statistically different. For instance, it can be used to test whether the mean income of men differs significantly from that of women.

   - **Analysis of Variance (ANOVA):** An extension of the t-test, ANOVA is used when comparing the means of three or more groups. For example, sociologists can use ANOVA to examine whether educational achievement varies across different socioeconomic groups.


#### d. **Correlation and Regression**

   - **Correlation:** A statistical measure (denoted as 'r') that describes the strength and direction of a relationship between two variables. Correlations can range from -1 to +1, where +1 indicates a perfect positive relationship, -1 indicates a perfect negative relationship, and 0 indicates no relationship.

   - **Regression Analysis:** A more advanced statistical tool used to understand the relationship between an independent variable (predictor) and a dependent variable (outcome). Simple linear regression models the relationship between two variables, while multiple regression considers the influence of several independent variables on a dependent variable.


### 3. **Bivariate and Multivariate Analysis**


Sociologists are often interested in relationships between two or more variables:


#### a. **Bivariate Analysis**

This involves examining the relationship between two variables. The most common methods include:

   - **Cross-tabulation (Contingency Table):** A table that shows the frequency distribution of two categorical variables. Sociologists use cross-tabulation to explore how one variable is distributed across levels of another, such as how political party affiliation varies by age group.

   - **Chi-Square Test:** A statistical test used to determine whether there is a significant association between two categorical variables.


#### b. **Multivariate Analysis**

Multivariate analysis involves examining relationships between three or more variables simultaneously. Techniques such as **multiple regression** or **factor analysis** help sociologists understand the complex interrelationships among variables and control for confounding factors.


### 4. **Using Statistics in Sociological Research**

Statistics are essential in sociological research for the following reasons:

   - **Objectivity and Precision:** Statistical methods provide an objective basis for testing hypotheses and identifying patterns, reducing the risk of researcher bias.

   - **Data Summarization:** Large datasets can be summarized and represented effectively through statistical tools, making complex social phenomena easier to understand.

   - **Predictive Analysis:** Statistical techniques such as regression help sociologists make predictions about social outcomes, like how certain factors (e.g., education, income, age) influence behaviors or trends.

   - **Policy and Decision Making:** Findings from sociological research often inform policymakers, and statistical analysis adds weight to the evidence provided.


### Conclusion

Basic statistics are an indispensable part of sociological research. From descriptive statistics that summarize data to inferential methods that allow researchers to draw conclusions about broader populations, statistical tools enable sociologists to analyze social phenomena scientifically. Understanding these basic concepts is crucial for designing studies, analyzing data, and interpreting research findings in a meaningful way.

Action Plan for Research Using the World-System Perspective

 Action Plan for Research Using the World-System Perspective


10. Action Plan for Research Using the World-System Perspective


Question: Outline a research plan that incorporates the world-system perspective to study a global-local issue relevant to Nepal. What theoretical and empirical methods would you employ to investigate this issue?

Relevant Topics: Research methodology based on Wallerstein’s world-system theory, group work agenda from the Action Plan unit.


### Research Plan: Labor Migration and Global Capitalism in Nepal


#### Research Topic

The study will investigate the relationship between labor migration and global capitalism in Nepal, focusing on how global economic forces shape migration patterns, the experiences of migrants, and the socio-economic impacts on local communities.


#### Objectives

1. To analyze the motivations behind labor migration from Nepal in the context of global capitalism.

2. To examine the policies and institutional mechanisms governing labor migration in Nepal.

3. To assess the socio-economic impacts of remittances on local communities and national development.

4. To explore the challenges faced by Nepali migrants in destination countries and the implications for their families back home.


### Theoretical Framework

This research will utilize **Wallerstein’s world-systems theory** as the primary theoretical framework. The theory will help to contextualize Nepal's labor migration within the broader capitalist world-system, emphasizing the core-periphery dynamics that influence migration patterns and economic relations.


#### Key Concepts

- **Core-Periphery Dynamics**: Understanding how Nepal, as a peripheral nation, is integrated into the global economy and how this affects labor migration.

- **Unequal Exchange**: Analyzing how the economic benefits of labor migration are distributed between core countries and Nepal.

- **Dependency**: Exploring how reliance on remittances may perpetuate economic dependency and underdevelopment in Nepal.


### Methodology


#### 1. **Theoretical Methods**

- **Literature Review**: Conduct a comprehensive review of existing literature on labor migration, global capitalism, and world-systems theory. This will include works by Wallerstein, as well as studies specific to Nepal, such as those by Bandita Sijapati and Amrita Limbu.

- **Conceptual Framework Development**: Develop a conceptual framework that integrates world-systems theory with the specific context of labor migration in Nepal.


#### 2. **Empirical Methods**

- **Qualitative Research**: 

  - **Interviews**: Conduct semi-structured interviews with key stakeholders, including migrant workers, their families, policymakers, and representatives from NGOs working on migration issues. This will provide insights into personal experiences and the impact of migration on families and communities.

  - **Focus Groups**: Organize focus group discussions with migrant communities to explore collective experiences and perceptions regarding migration and remittances.


- **Quantitative Research**:

  - **Surveys**: Design and distribute surveys to collect data on migration patterns, remittance flows, and socio-economic impacts on households. This data will help quantify the relationships between migration, remittances, and local development.

  - **Statistical Analysis**: Use statistical methods to analyze survey data, identifying trends and correlations related to labor migration and economic outcomes.


### Data Sources

- **Government Reports**: Analyze reports from the Nepalese government and international organizations regarding labor migration policies, remittance statistics, and economic data.

- **NGO Publications**: Utilize research and reports from NGOs focused on labor rights and migration in Nepal to understand the challenges faced by migrants.

- **Academic Journals**: Review scholarly articles that discuss labor migration, global capitalism, and their implications for development in Nepal.


### Expected Outcomes

1. **Comprehensive Understanding**: Provide a nuanced understanding of how global capitalism influences labor migration in Nepal and the socio-economic implications for migrants and their families.

2. **Policy Recommendations**: Develop recommendations for policymakers to improve labor migration governance, enhance protections for migrants, and maximize the developmental benefits of remittances.

3. **Contribution to Theory**: Contribute to the theoretical discourse on labor migration and global capitalism by applying world-systems theory to the specific context of Nepal.


### Timeline

- **Months 1-2**: Conduct literature review and develop conceptual framework.

- **Months 3-4**: Design research instruments (interviews, surveys) and obtain necessary approvals.

- **Months 5-6**: Conduct fieldwork (interviews, focus groups, surveys).

- **Months 7-8**: Analyze data and compile findings.

- **Months 9-10**: Write and disseminate research report.


### Conclusion

This research plan outlines a comprehensive approach to studying labor migration and global capitalism in Nepal through the lens of world-systems theory. By employing both qualitative and quantitative methods, the study aims to uncover the complexities of migration, the experiences of Nepali migrants, and the broader socio-economic implications for Nepal within the global capitalist framework.


Citations:

[1] http://www.eolss.net/sample-chapters/c04/e6-99a-36.pdf

[2] https://web.mit.edu/esd.83/www/notebook/WorldSystem.pdf

[3] https://en.wikipedia.org/wiki/World-systems_theory

[4] https://www.journals.uchicago.edu/doi/abs/10.1086/226431

[5] https://www.sciencedirect.com/topics/social-sciences/world-systems-theory

[6] https://www.sociopedia.co/post/world-systems-theory

[7] https://link.springer.com/referenceworkentry/10.1007/978-3-319-74336-3_372-1

[8] https://www.oxfordbibliographies.com/display/document/obo-9780199743292/obo-9780199743292-0272.xml


Outlining a research plan implicating elements of the perspective

 Outlining a research plan implicating elements of the perspective


VI.Action Plan: Outlining a research plan implicating elements of the perspective


This unit is utilized to promote group work intended to develop tentative ideas which link up the

world-system perspective and its variants with group research agendas. It is expected that the

‘linkaging’ carried out in the preceding unit will provide valuable inputs for the preparation of

group research agendas.


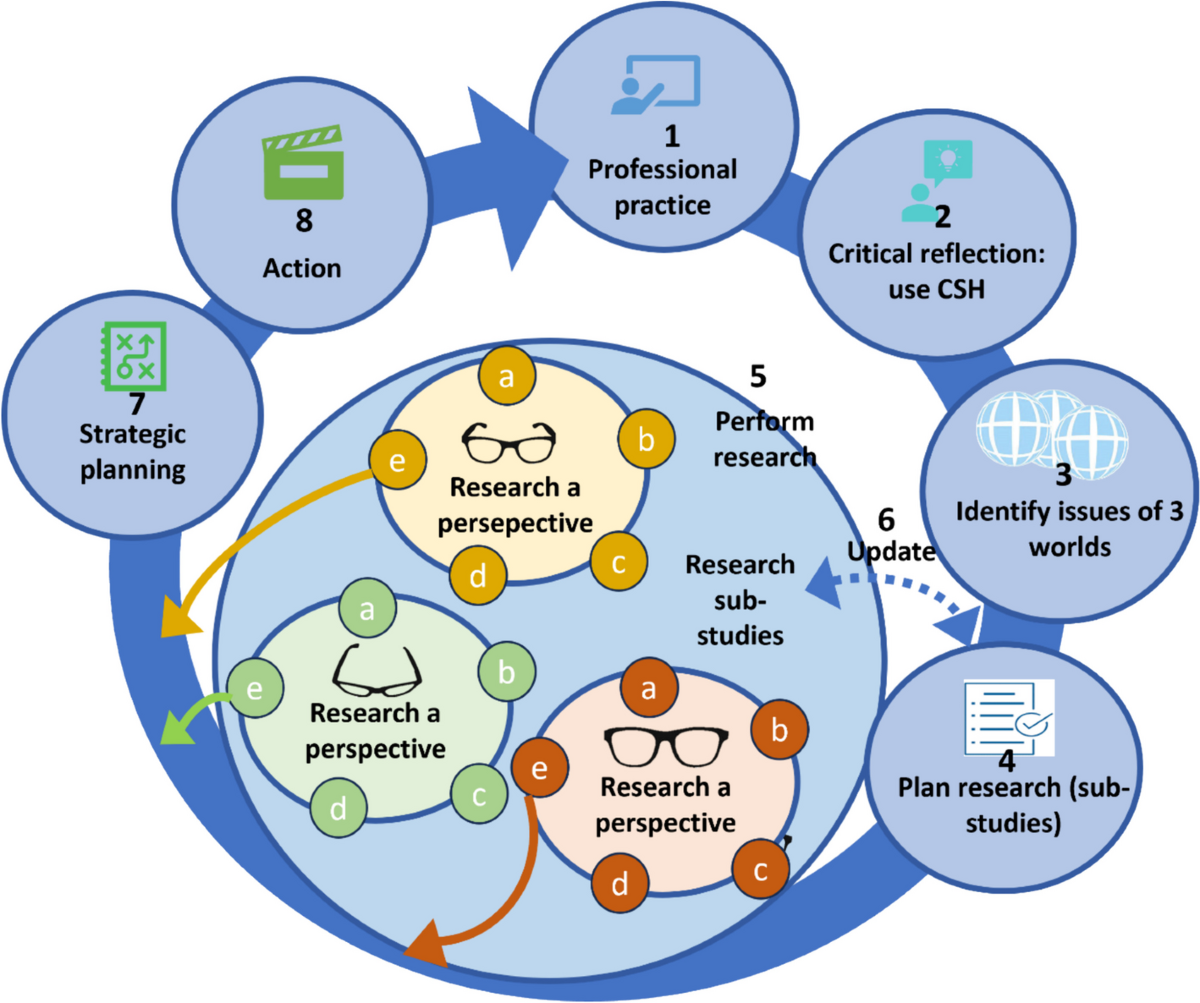
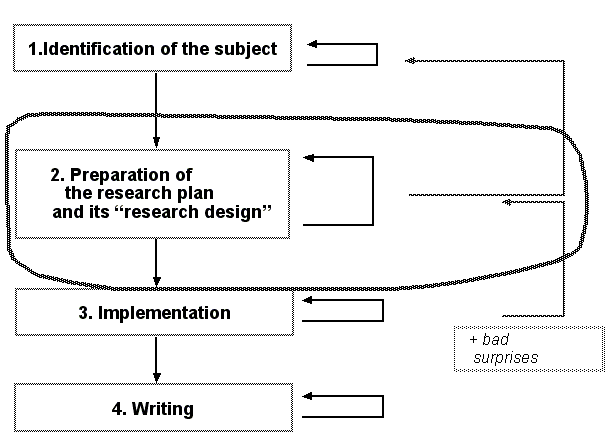
### VI. Action Plan: Outlining a Research Plan Using the World-System Perspective


This unit aims to guide students in formulating a **research plan** that incorporates the key elements of the **world-system perspective** and its variants. Building on the theoretical linkages discussed in the previous unit, the objective is to develop group research agendas that explore **global-local dynamics**, applying world-system theory to specific **empirical cases** relevant to Nepal or other regions of interest.


#### 1. **Defining the Research Objective**


The first step in developing a research plan is to clearly define the **research objective**. The group should collectively decide on a specific **sociological issue** or **phenomenon** that they want to explore using the **world-system perspective** as a theoretical framework. This issue could relate to:


- **Economic dependency** and the role of **remittances** in shaping local economies.

- The impact of **globalization** on **labor migration** and **employment patterns** in Nepal.

- The influence of **global trade** on **agrarian structures** and **class dynamics** in rural Nepal.

- Analyzing **Nepal's peripheral status** and its political and economic relationship with **core nations**.

- Understanding the role of **international institutions** (e.g., World Bank, IMF) in shaping **national policies**.


Once the group has selected an issue, they can begin crafting a research **question** or **hypothesis** that connects the world-system perspective to the local context. For example, one might ask, *"How does Nepal's position in the periphery of the world-system affect its reliance on foreign remittances for economic stability?"* or *"What role do international trade agreements play in reinforcing class inequalities in rural agricultural communities?"*


#### 2. **Reviewing Literature**


The next step involves conducting a **literature review**. Drawing from both **world-system theory** and **local texts** (such as those discussed in the **Colloquium on Nepal**), students should gather academic resources, articles, books, and case studies that provide insights into their research question.


For example:

- **Wallerstein’s core-periphery model** and its application in peripheral economies like Nepal.

- **Dependency theory** and critiques from scholars such as **Andre Gunder Frank**, **Chaitanya Mishra**, or **Theda Skocpol**.

- Empirical studies on **labor migration**, **agrarian economies**, or **global commodity chains** in peripheral nations.


This literature will serve as the foundation for the theoretical framework and inform the group’s understanding of both **global structural forces** and **local specificities**.


#### 3. **Developing Research Methodology**


The next stage involves outlining a **research methodology**. The group should decide which **methods** will be most appropriate for collecting and analyzing data. Possible methods include:


- **Qualitative Methods**:

  - **Interviews** with migrant workers, agricultural laborers, or local businesses to understand how global economic forces impact their livelihoods.

  - **Focus groups** with community members affected by foreign aid, remittances, or international trade policies.

  - **Ethnographic fieldwork** to observe the dynamics of rural or urban communities and their integration into global markets.


- **Quantitative Methods**:

  - **Surveys** to gather statistical data on remittance flows, income inequality, or employment patterns among migrant laborers.

  - **Data analysis** of economic indicators such as GDP, trade deficits, or remittance contributions to the national economy, which can highlight Nepal’s dependent position in the world economy.


- **Case Studies**:

  - Focus on specific regions (e.g., rural villages affected by cardamom cultivation or migrant-heavy districts) to explore local-global linkages in detail.

  - **Comparative analysis** of Nepal with other peripheral nations, drawing parallels and differences in how global capitalism shapes development outcomes.


#### 4. **Linking Theory and Data**


In this stage, students should focus on **linking the theoretical framework**—the world-system perspective—with the **empirical data** they plan to collect. The key here is to use **Wallerstein’s concepts** of core, periphery, and semi-periphery, as well as the **criticisms** and **variants** of the theory, to interpret the data and draw meaningful conclusions.


For example:

- If the group is studying labor migration, they might analyze how the **core countries** (Gulf states, Malaysia) extract cheap labor from **peripheral countries** like Nepal, and how this dynamic impacts local economic stability and social structures.

- If the focus is on agriculture, the group can explore how **global commodity chains** (e.g., in the cardamom industry) integrate local farmers into global markets while maintaining unequal terms of trade, as per the **dependency theory** framework.


By continuously referencing **world-system theory** and its variants throughout the data collection and analysis process, the group will ensure that their research is grounded in the theoretical concepts they have learned.


#### 5. **Organizing Group Work**


Each group should assign specific **tasks** and **roles** to members to ensure efficient collaboration. Possible roles include:


- **Research Coordinator**: Oversees the progress of the research, ensuring deadlines are met and the methodology is followed.

- **Literature Review Lead**: Gathers and organizes relevant theoretical and empirical literature.

- **Fieldwork/Survey Lead**: Manages data collection, including designing surveys or organizing interviews.

- **Data Analyst**: Analyzes quantitative or qualitative data collected during the research process.

- **Writer/Editor**: Drafts the research paper, ensuring it integrates theoretical and empirical components effectively.


Regular group meetings should be held to discuss progress, resolve issues, and ensure that everyone is aligned with the project goals.


#### 6. **Timeline and Milestones**


The group should establish a **timeline** with clear **milestones** for each phase of the research process. An example timeline might look like this:


- **Week 1-2**: Finalize research topic and develop research questions.

- **Week 3-4**: Conduct literature review and refine theoretical framework.

- **Week 5-6**: Design research methodology and create data collection tools (surveys, interview guides, etc.).

- **Week 7-8**: Collect data through interviews, surveys, or fieldwork.

- **Week 9-10**: Analyze data and link findings to world-system theory.

- **Week 11-12**: Draft the research paper and review findings as a group.

- **Week 13-14**: Finalize and submit the research paper.


#### 7. **Final Output and Presentation**


The final output of the group’s research will be a **research paper** that incorporates both the **theoretical insights** from the world-system perspective and **empirical data** collected through fieldwork or secondary sources. This paper should:


- Clearly articulate the **research question** and theoretical framework.

- Present a thorough analysis of the **data**, demonstrating how the world-system theory and its critiques explain local realities.

- Discuss the **implications** of the findings for both **global inequality** and **local development** in Nepal (or the chosen region).


Additionally, the group may be required to **present their findings** to the class, fostering further discussion and encouraging peer feedback. The research paper and presentation should reflect the group’s ability to **think critically** and **apply theoretical knowledge** to real-world issues.


#### 8. **Conclusion**


The development of a **group research agenda** that applies the world-system perspective to specific empirical issues promotes **collaborative learning** and the **practical application of theory**. By engaging in this process, students not only deepen their understanding of **global-local dynamics** but also hone their **research skills**, preparing them for future academic or professional work in **sociology**, **development studies**, or related fields. This **action plan** ensures that the world-system perspective becomes not just a theoretical framework but a tool for understanding and addressing **real-world problems**, especially in contexts like Nepal.


Here are **10 comprehensive questions** that cover the key topics from your course, designed to prepare you for your exams:


### 1. **Historical Context of the World-System Perspective**

   - **Question**: Discuss the evolution of the capitalist world-system according to Immanuel Wallerstein. How did the rise of capitalist agriculture and the European world-economy in the sixteenth century shape global social change?

     - *Relevant Readings*: Immanuel Wallerstein, “On the Study of Social Change” (The Modern World-System); William I. Robinson, “Globalization and the Sociology of Immanuel Wallerstein: A Critical Appraisal.”


### 2. **Capitalism and the World-System**

   - **Question**: Explain Wallerstein’s concept of the **capitalist world economy**. How does the production of surplus value contribute to global economic polarization between the core and the periphery?

     - *Relevant Readings*: Wallerstein, Chapter 2 of *World-Systems Analysis: An Introduction*.


### 3. **The Role of Nation-States in the World-System**

   - **Question**: Analyze the rise of the modern nation-state system. How did sovereign nation-states, colonies, and the interstate system develop within the framework of the capitalist world-system?

     - *Relevant Readings*: Wallerstein, Chapter 3 of *World-Systems Analysis*.


### 4. **Crisis of the Modern World-System**

   - **Question**: What are the key factors contributing to the crisis of the modern world-system, as described by Wallerstein? How do bifurcation, chaos, and choices shape the future of global capitalism?

     - *Relevant Readings*: Wallerstein, Chapter 5 of *World-Systems Analysis*; Frank Elwell, “Wallerstein’s Crisis of Capitalism”; Christopher Chase-Dunn, “Five Linked Crises in the Contemporary World System.”


### 5. **Critiques of the World-System Perspective**

   - **Question**: Critically evaluate Theda Skocpol’s critique of Wallerstein’s world capitalist system. What are the theoretical and historical limitations of world-systems analysis?

     - *Relevant Readings*: Theda Skocpol, “Wallerstein’s World Capitalist System: A Theoretical and Historical Critique.”


### 6. **Debates on the Origins of Capitalism**

   - **Question**: Examine the debates surrounding the time-scale and geographical origins of the capitalist world-system. How do the works of scholars like Andre Gunder Frank and Barry Gills challenge Wallerstein’s view on capitalism’s European origins?

     - *Relevant Readings*: Andre Gunder Frank, “Immanuel and Me Without Hyphen”; Barry Gills, “The Continuity Thesis on World Development.”


### 7. **World-Systems and Dependency Theories**

   - **Question**: Compare and contrast world-systems theory with dependency theory. What are the key critiques and new directions proposed by scholars like James Petras in understanding global inequalities?

     - *Relevant Readings*: James Petras, “Dependency and World-System Theory: A Critique and New Directions.”


### 8. **Development and Underdevelopment in Nepal**

   - **Question**: Using a world-system perspective, analyze the issues of development and underdevelopment in Nepal. How do global economic forces impact Nepal’s peripheral status in the world economy?

     - *Relevant Readings*: Chaitanya Mishra, “Development and Underdevelopment in Nepal”; Piers Blaikie, John Cameron, and David Seddon, *Nepal in Crisis*.


### 9. **Labor Migration and Global Capitalism in Nepal**

   - **Question**: Discuss the relationship between **labor migration** and global capitalism, using Nepal as a case study. How do policies and institutional mechanisms governing labor migration reflect Nepal’s position within the capitalist world-system?

     - *Relevant Readings*: Bandita Sijapati and Amrita Limbu, *Governing Labor Migration in Nepal*.


### 10. **Action Plan for Research Using the World-System Perspective**

   - **Question**: Outline a research plan that incorporates the world-system perspective to study a global-local issue relevant to Nepal. What theoretical and empirical methods would you employ to investigate this issue?

     - *Relevant Topics*: Research methodology based on Wallerstein’s world-system theory, group work agenda from the Action Plan unit.


These questions are designed to encourage **critical thinking**, **theoretical analysis**, and the application of **world-systems theory** to specific contexts, including **Nepal**. You can use them to focus your exam preparation and deepen your understanding of the material.

How to choose a research topic?

How to choose a research topic?

Select a topic

Choosing an interesting research topic is your first challenge. Here are some tips:

 Choose a topic that you are interested in. The research process is more relevant if you

care about your topic.

 Narrow your topic to something manageable.

Social Research and Making Research Sociological

Social Research and Making Research Sociological


Definition of Social Research

According to C.A. Moser : “Social research is a systematized investigation to gain new

knowledge about social phenomenon  and problems.”

According to P.V. Young: “Social research is a scientific task which by means of logical

methods, aim to discover new facts or old facts and to analyze their sequences,

interrelationships, casual explanations and natural laws

which govern them.”


Social Research: 

Social Research is a method used by social scientists and researchers to learn

about people and societies so that they can design products/services that

accommodate to various needs of the people.


Different socio-economic groups belonging to different parts of a county think

differently. Various aspects of human behavior need to be addressed to

understand their thoughts and feedback about the social world, which can be

done using Social Research. Any topic can activate social research – new

feature, new market trend or an upgrade in old technology.


What is social Research ?

Society is an organized group of persons associated together with shared objective, norms and

values pertain to the society.


People have social life and social process. Research is systematic and organized effort to

investigate a specific problem that needs a solution. It contributes to the

general body of knowledge. It also corrects human knowledge.

Social research now can be defined as the systematic and objective analysis and recording of

controlled  observations that may lead to the development of generalization,

principles or theories resulting in prediction and possibly ultimate control of events in society. It

attempts to answer or solve social problems.

(eg. covid, cyber addict)


Social research is a research conducted by social scientists following a systematic

plan. Social research methodologies can be classified as quantitative or qualitative.

 Quantitative designs approach social phenomena through quantifiable evidence,

and often rely on statistical analysis of many cases (or across intentionally designed

treatments in an experiment) to create valid and reliable general claims. Related to

quantity.


 Qualitative designs is related to quality and emphasize understanding of social

phenomena through direct observation, communication with participants, or analysis

of texts, and may stress contextual subjective accuracy over generality.


Making Research Sociological

Sociologists conduct research on almost every area of human behavior. The research conducted

may be at the macro level, covering broad matters such as social structure, or at the micro

level, which addresses individualistic and small group interaction. Sociological research is

necessary for a variety of reasons. Research will confirm or deny the validity and extent of what

is considered to be true simply because it “makes sense.” Whereas culture has a significant

impact on what one believes to be true, there needs to be a more objective manner in which to

discover truth. Research provides the method through which truth can be discovered. To

discover this truth, scientific research is used.

There are a number of factors researchers must take into consideration beyond the research

method chosen. Some of these are beyond the control of the researcher. It involves a change in

the person’s behavior because he or she knows they are being studied. Gender and race are

also considerations that must be controlled by the researcher, especially when the sample

being studied or the subject of the research is gender or race related. Gender and race can be a

confuse making factors in sociological research, and sociologists need to take careful steps to

prevent gender or race differences from biasing their findings.


What is a Valid Sociological Topic?

Sociologists research just about every area of human behavior at both the macro and micro

levels.

No human behavior is ineligible=-disallowed) for research, whether it is routine or unusual,

respectable or reprehensible (inacceptable)


Common Sense and the Need for Sociological Research

Common sense cannot be trusted on as a source of knowledge because it is often limited and

based on limited information.

To move beyond common sense and understand what is really going on, it is necessary to do

sociological research. (eg. no disable person win the football game )


Controversy in Sociological Research

Social research can be very controversial be it private, political, etc. Often the findings of social

research threaten those who have a stake in the matters being studied. (the study of the crime

or criminal people is an example of such controversy.)


Gender in Sociological Research

Because gender can be a significant factor in social research, researchers take steps to prevent

it from biasing their findings.


Gender can also be an obstacle to doing research, particularly when the gender of the

researcher is different from that of the research subjects and the topic under investigation is a

sensitive one.


There are also questions regarding the degree to which findings from a sample made up

exclusively of one gender can be generalized to the other.


Ethics in Sociological Research

Ethics are of fundamental concern to sociologists when it comes to doing research.

Ethical considerations include being open, honest, and truthful; not harming the subject in the

course of conducting the research; protecting the anonymity of the research subjects; and not

misrepresenting themselves to the research subjects.


How Research and Theory Work Together

Sociologists combine research and theory in different ways. Theory is used to interpret data

(i.e. functionalism, symbolic interaction and conflict theory provide frameworks for interpreting

research findings) and to generate research. Research helps to generate theory.

What are the 5 components of a research?

 What are the 5 components of a research?

Research components are introduction, literature review, method, results,

discussion, and conclusion

Popular Posts